PROBABILITY - Using Tree Diagrams To Find The Sample Space
Using the Tree Diagrams to The Sample Space
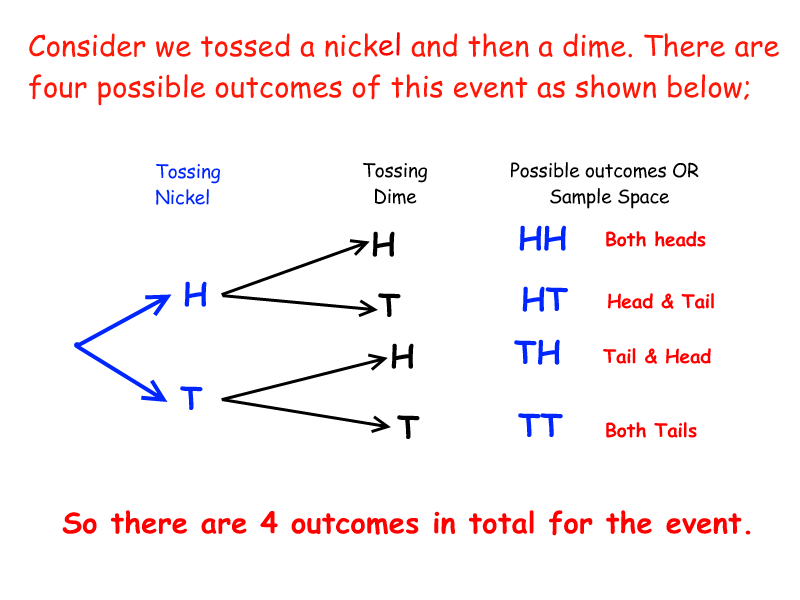
A sample space is a set of all the possible outcomes (possible results), for an experiment (event or activity). We can use many ways to find the sample space of an event and using tree diagrams is one of them.
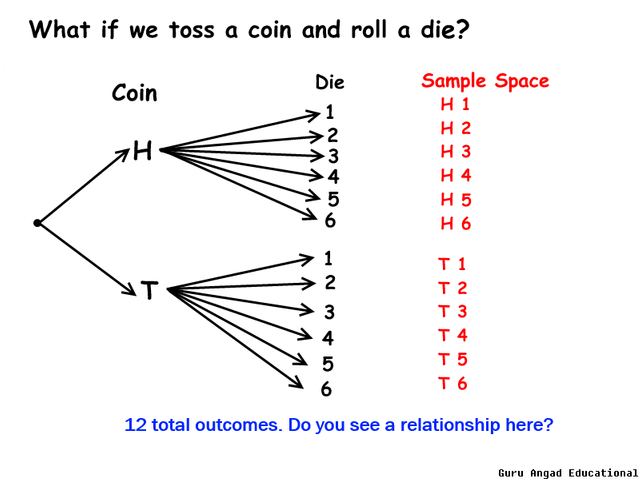
In this post we will learn how to draw a tree diagram of an experiment or an event to find the total number of outcomes or sample space using very simple examples of tossing coins or rolling dice.
Next we will figure out the relationship between the number of attempts (such as rolling, tossing, picking) and the total number of outcomes. Then we will start to find probability of very basic events.


Well-written! Easy to understand.
Resteemed!
Thanks for stopping by my dear friend @kenchung :)
That is similar to the subject, I was teaching lately. Kids asked me what means exclamation mark after the number? (example: 7!) And I told them...let's say we have 7 different cars, and if you should calculate number of all possible sequences of those cars, how would you do it? Answer is : 7x6x5x4x3x2x1 = 5040 So those 7 cars could be parked in 5040 different sequences. And we write that down as 7!=5040
Right @worldfinances, very well explained factorial notation :))
very much helpful to understand Probability. keep it up brother.
You are welcome Big Guy :))
Very neat and straight forward, I never understood probability in school but damn this was easy peesy
Thanks for stopping by @libert, I used to ignore probability in school cause they taught it very much at the end of the year and didn't have much interest to learn. But did good study of it once I started to teach.