Absolute Values
This post will be about absolute values. This topic is introduced in math courses in high schools and in introductory calculus courses in universities (and colleges).
The original page can be found here. This post has some updates which includes informative images (made in R).
Some of the images were generated from the statistical programming language R.
Absolute Values of Numbers
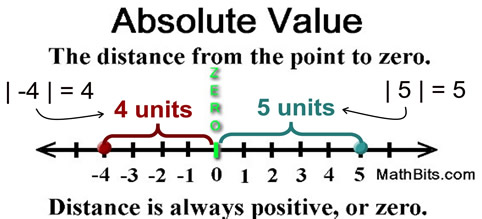
The simplest case of absolute values is with numbers. Absolute values are indicated by the vertical bars | |. Here are some examples showing how absolute value of numbers work.

The Absolute Function Of x
So far we have dealt with absolute value of numbers and not variables. We now deal with the general case and present the formal definition.

The absolute value function is an example of a piecewise function. The value of a piecewise function is dependent on the x-value. If x is at least 0 then I have the simple line of y = x for x at least 0. For x less than zero, the function is the y = -x negative sloped line.
Here is a visual of the absolute function centered at x = 0. You can easily see that this V shaped like function is symmetric along x = 0.
Some Tranformations Of The Absolute Function
I do not really want to get into great details about function transformations for the absolute function here. I will go over them quickly.
If we had -|x| then the picture above would be upside down and would look like a hat. The regular absolute value function |x| has been reflected about the x-axis to create -|x|.
Horizontal Shifts
We now consider intercepts with the x variable inside the absolute value. If we had |x - 5| then the origin point at (0,0) from |x| would be shifted to the right 5 units to the point (5, 0) for |x - 5|. If we had |x + 3| then the origin point at (0,0) from |x| would be shifted to the left 3 units to the point (3, 0). The image below is for |x - 5|.
Vertical Shifts
Any vertical shifts would have numbers outside the absolute value function. For example, |x| + 3 would shift the every point from |x| up by 3 units. As an example, the origin of (0, 0) would be shifted to (0, 3).
Domain and Range
For the absolute function |x|, the domain is all real numbers for x. The range for |x| is for all positive numbers and zero. In simple terms, you can choose any real number for x and the output for |x| is always at least zero.
Some Properties
There are properties associated with the absolute value function. Here are a few.

- The first property is the range of the absolute value of
xas stated in the previous section. - If
x = 0then|x| = 0. Also if|x| = 0this means that for that to happen thenx = 0. - This third property is a multiplication rule for absolute values.
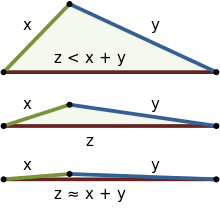
- This fourth property is known as the triangle inequality. The visual below will help in visualization.
Absolute Values & Inequalities
Absolute values can be annoying but when you add inequalities to the mix, it becomes more annoying/difficult.
These next two properties come in handy when dealing with inequalities. (The constant a is some real number.)

For example if we have |x - 5| < 2, we can solve for x as follows:

Since a picture is worth "a thousand words", here is a visual of |x - 5| < 2. The solution set for x is the small red V portion below the dashed line (of y = 2 and above y = 0).
Here is another example where we have |x - 1| greater than or at least 3. The second property is used.

The plot appears to be uneven due to the viewing range for x. The solution set is either x less than or equal to 2 or x greater than or equal to 4 as indicated by the two red line pieces above the black dashed lines.
Notes
There are more things that can be said about the absolute value of x. The topic of absolute values and complex numbers are not mentioned here.
I did not talk about horizontal stretch or compression here.
If you are wondering about the R code used to make these plots, I have included a template below. (a is the horizontal shift and y_int is the y-intercept).
# Absolute Value Plot:

library(ggplot2)

a= 2

absolute_funct <- function(x){
  ifelse(x >= a, (x - a), -(x - a)) + y_int
}

ggplot(data.frame(x = c(-a - 2, a + 2)), aes(x = x)) +
  stat_function(fun = absolute_funct, colour = "red") + xlim(c(-a - 2, a + 2)) +
  labs(x = "\n x", y = "y \n") +
  theme(plot.title = element_text(hjust = 0.5),
        axis.title.x = element_text(face="bold", colour="blue", size = 12),
        axis.title.y = element_text(face="bold", colour="blue", size = 12)) +
  annotate("text", x = a, y = f(a), parse = TRUE, size = 5, fontface = "bold",
           label="y == abs(x - a) + y_int") +
  geom_hline(yintercept = 0, colour = "black") +
  geom_vline(xintercept = 0, colour = "black")
Thanks, upvoted.
And for new members...
!-=o0o=-!
To follow curated math content follow @math-trail.
If you wish @math-trail to follow you then read this article.
Click here for Mathematics forum on chainBB
Congratulations @dkmathstats! You have completed some achievement on Steemit and have been rewarded with new badge(s) :
Click on any badge to view your own Board of Honor on SteemitBoard.
For more information about SteemitBoard, click here
If you no longer want to receive notifications, reply to this comment with the word
STOPCongrats! You're a winner of @msg768's daily giveaway #28. To find out more, click HERE.