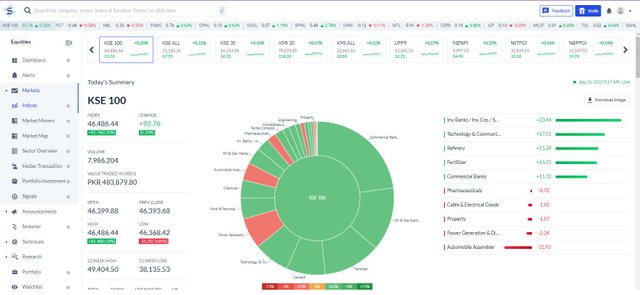
Todays' Market Summary
The KSE 100 Index, also known as the Karachi Stock Exchange 100 Index, is a benchmark stock index in Pakistan that represents the performance of the top 100 companies listed on the Pakistan Stock Exchange (formerly the Karachi Stock Exchange). Here's a brief history of the KSE 100:
Formation and Early Years (1991-2000): The KSE 100 Index was launched on November 18, 1991. At its inception, it had a base value of 1,000 points. During its early years, it primarily included companies from various sectors of the Pakistani economy. The index provided a way for investors and analysts to gauge the overall performance of the stock market in Pakistan.
Growth and Expansion (2000s): The index experienced significant growth during the early 2000s. Pakistan's economy was on an upward trajectory, and the stock market was attracting both domestic and foreign investors. This period saw the inclusion of more companies from diverse sectors, including banking, telecommunications, energy, and textiles.
Financial Crisis and Recovery (2008-2010): Like many other global stock markets, the KSE 100 Index was not immune to the effects of the global financial crisis of 2008. It saw a sharp decline in value during this period. However, it began to recover in subsequent years as the Pakistani economy rebounded.
Political and Economic Challenges (2010s): The KSE 100 Index faced various challenges during the 2010s, including political instability, security concerns, and economic fluctuations. Despite these obstacles, it continued to be a key barometer of Pakistan's economic health and a destination for both local and international investors.
Climbing to New Heights (2010s-2021): During the latter part of the 2010s, the KSE 100 Index achieved new record highs, reflecting growing investor confidence in Pakistan's economic prospects. It reached its all-time high of over 52,000 points in May 2017.
COVID-19 Pandemic (2020): The COVID-19 pandemic had a significant impact on global financial markets, including the KSE 100 Index. It experienced volatility and a sharp decline in early 2020, but, like many other markets, it rebounded as stimulus measures and vaccine developments provided hope for economic recovery.
Ongoing Evolution (2021-Present): As of my last knowledge update in September 2021, the KSE 100 Index continued to be a prominent indicator of Pakistan's stock market performance. However, its trajectory beyond that date would depend on various factors, including economic policies, geopolitical developments, and global economic conditions.
Please note that the history and performance of the KSE 100 Index may have evolved since my last knowledge update, and it's advisable to consult up-to-date financial sources for the most current information on this index.
MARKET MAP:
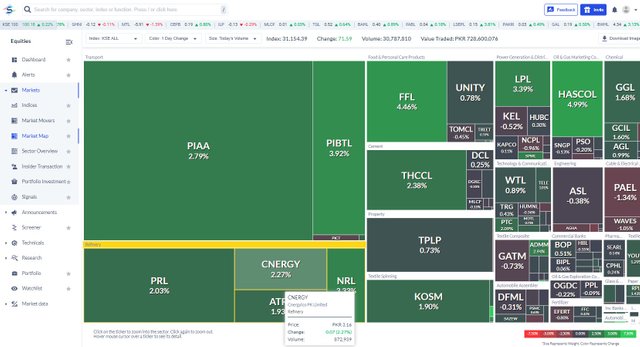
A market map is a visual representation that helps businesses analyze and understand their competitive landscape. It displays key competitors and relevant market segments, enabling companies to identify opportunities and threats. Market maps often categorize competitors based on factors such as market share, product offerings, pricing, and target audience. This tool aids strategic decision-making by highlighting areas for innovation or differentiation. Additionally, market maps assist in tracking market dynamics, allowing businesses to adapt to changing conditions. By providing a comprehensive view of the competitive environment, market maps empower organizations to refine their strategies, enhance market positioning, and ultimately achieve sustainable growth.
SECTOR OVERVIEW:
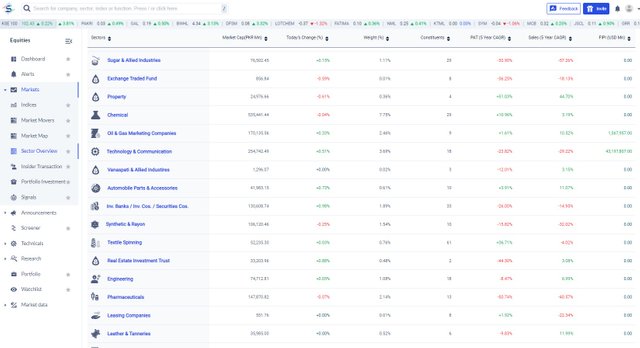
A sector overview is a concise summary of a specific industry or market segment. It typically includes key information like market size, trends, major players, and growth prospects. Sector overviews are essential for investors, businesses, and policymakers to make informed decisions and understand the current state of an industry.
FIPI Data:
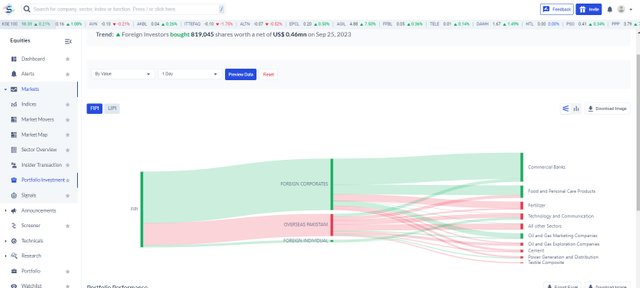
As of my last knowledge update in September 2021, FIPI stands for "Foreign Institutional Portfolio Investment" data. It refers to information regarding foreign institutional investors' investments in a country's financial markets, including stocks, bonds, and other securities. This data is crucial for tracking foreign investment trends, understanding market sentiment, and assessing the attractiveness of a country's financial markets to foreign investors. It includes details about the types of securities foreign investors are buying, the amount of money being invested, and changes in investment patterns over time. FIPI data is commonly monitored by governments, financial institutions, and investors for economic analysis and policymaking. Please note that the availability and reporting of FIPI data may vary by country and time, so it's advisable to consult the latest sources for the most up-to-date information.
Thank you for your time
i am inviting my these friends @sahmie @fatima22@hamzayousafzai