[Indexes & Commodities&Forex] SPX to 2700, Hang seng to 30k, Dax to 13.3k, Gold possibly to 1360, Oil to 70$ per barrel, Btc to five figures
Some of the indexes are expected to go up. For the end of year, S&P would be expected to go north of 2600 to 2700.
But before I detail more about the index, I'd like to add a small commentary.
Maybe you don't know, but there are some followers, who would like best to do 'otherwise' to what some traders are advertising, for two reasons:
- A statistic would be made, and if the 'masses' are long, then the 'big money' would like to take the other side of the trade.
- Even if some traders/chartists are right and would predict it correctly, there are some 'big money' market influencers who would like to paint in history that some traders aren't that good. For example if there is one trader that makes money with a specific strategy and gives signals about it in a public way, sometimes, the 'market influencers' as it's best to call them, intentionally change the entire strategy, as to make sure as few as possible public trading ideas would work. For example, there are patterns that would repeat themselves for years. As soon as some 'targeted traders' enter into those positions, they, being the 'market influencers' would sometimes use and have algos that in general would make sure to avoid that those traders would get the maximum profit, as before. So in this case, sometimes markets would most likely be stalled or go against the position of the trader, as to minimize as much as possible the profit yield, and if possible, send it's trades into negative territory. Also, in some specific cases, 'market influencers' would go as far as hunting specific stops of those specific traders, right at the limit. The stops in 'forex market' are generally open and can be seen by 'market influencers'.
Despite this, some trades would work, but, for example in bitcoin, last time I posted, after I posted, btc fell down, but, in the end it got back up as expected at a nice price range of 4800$.
What is written here, or what I'm trying to say is the following: "Some traders have a 'market influencer' who makes a lot of trouble for some traders, reducing the probability of success of a successful strategy, between 40% to 70%.
And to end this, some market influencers would do it only for the fun to create pain in all sorts of traders.
These posts are in general educational and give hints as to what happens in the markets. As a trader, these hints are generally useful. But if a trend does not work, the trader knows how to stop any of it's losses and reanalyze it's risk:reward profile and time necessary to get the reward.
So what this means, is that if some predictions here don't happen, there is no problem.
So, to end this clarification, some 'followers' can be here as 'market influencers', and can decide(when they have close to unlimited capital), to do exactly the opposite of some trades or strategies posted here.
As a result, here, the readers will be provided with the default scenario, and then with the 'alternative scenario' when things go the opposite way, and sometimes, with an 'alternative scenario' to either the default scenario or the first alternative scenario.
This way, the trades and their reversals can be well explained.
Now let's begin. First let's look at the dashboard of cryptocurrencies, sorted by volume.
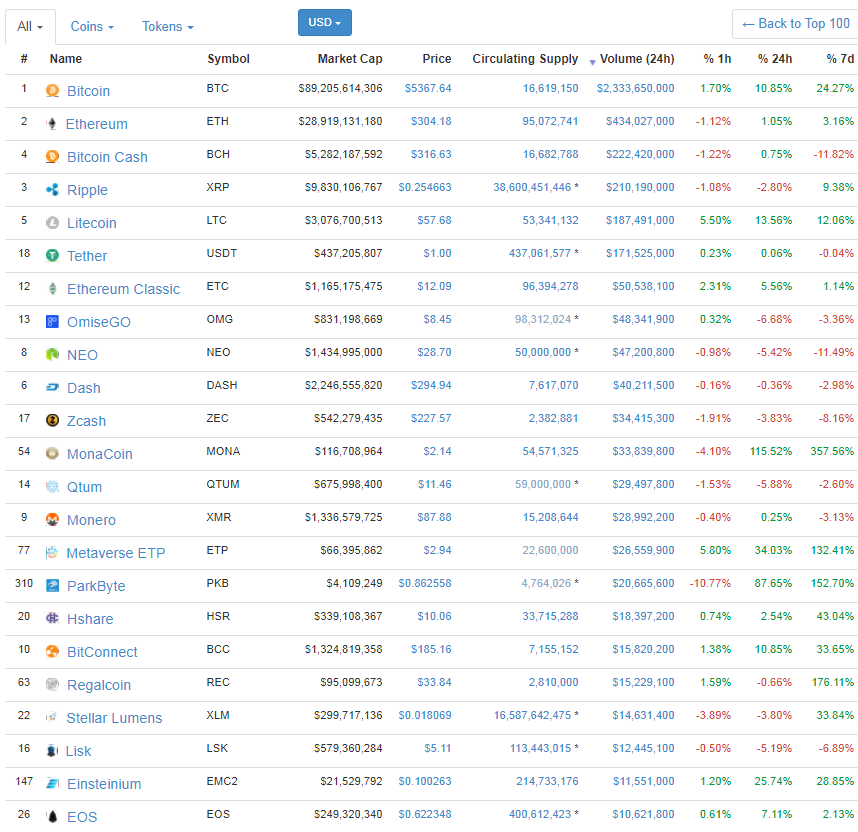
Bitcoin up 10% today, with some small alts doing some competition.
The main strength still is bitcoin.
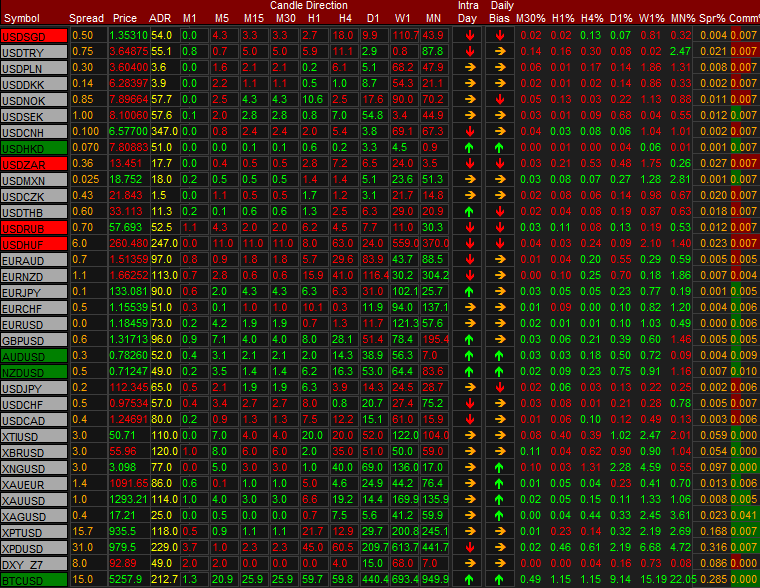
Next, is the dashboard of Indexes and Commodities(3h earlier):
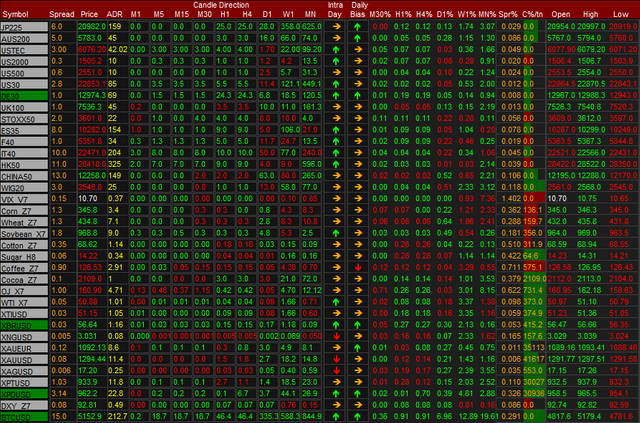
A majority of indexes are up between 1-3% this past month.
Nikkei up 3%, Dow up 2% and Poland index(WIG20) up 3% too.
Vix is down close to 1 point since the start of this month(which nets a 7% loss)(but has a wide spread of 0.15 points or 1.4%).
As for commodities...
Corn and Wheat are down 2.3%.
Soybean and Cotton up 0.2%.
Sugar up 1.4% while Coffee down 0.48%.
Cocoa and OJ(Orange Juice have the biggest gains).
With Cocoa being up close to 3.5%.
And Orange Juice being up by a whooping 8.1%.
Wti Crude oil and Natural Gas are down by 1.1% and 1.6%, while ...
...Brent Crude oil is up by 0.2%, widening the spread between WTI Crude and Brent Crude.
Thanks to recent USD weakness, Gold and Silver gain this month 1.1% and 3.6% respectively.
Also, Platinum and Palladium are also up by a hefty gain of 2.5% and 3%, most notably from Palladium...
Which rose close to 5% this week...
A small bump in the DXY value of 0.2% depreciation this month or 0.8% this week, showed hefty gains of 1%...
In the majority of currencies, be it Majors or exotics, and of course, commodities like precious metals, which on average...
Gained between 1% and 3% this month.
Bitcoin is another expected big winner....
With a whooping up move of close to 20% this month.
12% up this week alone.
And close to 7% up today.
The big winners here?
Bitcoin, with 20% up.
Orange Juice with 8% up(though the spread is much wider than bitcoin's( 0.6% vs 0.3%). Cocoa is also up 3%.
The VIX index is down 7%, which propelled the stock indexes, and thus...
Nikkei is up 3%, followed closely by the Dow with 2% up and another notable mention is WIG20 with 3% up.
Silver with 3% up, leads the way in metals, followed closely by Platinum and Palladium, up 2.5% and 2.8%.
Gold, slower, but up 1.1%.
The losers?
Contrary to the expectations, a weak dollar doesn't mean strong price for crude, gas, or grains.
Natural Gas is down 1.6%, followed by WTI Crude with 1.1% down.
Though Corn and Wheat are down 2.5% on average. Dollar weakness has no effect on falling price of grains.
Now let's see some charts and predictions.
The price expectation for SPX is high... 3000, 3100 or higher, by the end of the year 2018...
There will be no slow downs, at this pace.
The trend is likely invalidated at prices dropping below 2400.
Up move expected to be above 3000, by the end of 2018.
Was going to post this idea at the end of september - at the beginning of october, but sometimes people are more busy.
(I longed spx from 2500 and above in the beginning of this month).
So get this straight. No NK, not much of drawdowns. The price of S&P is set to go to 3000 or above by end of 2018.
What happens after, is a mystery. Either be, higher highs, or massive selling.
Question is, how massive would a correction of 10% or 20% look from the highs or 3000+ for the S&P?
My expectation is no correction of 5% or even 10% will happen until highs north of 3000+ for S&P are reached.
This was my expectation since the beginning of October and I may stand by it.
However the disclaimer at the beginning of this presentation, says that, sometimes...
"Market Influencers" will try to interfere or create an opposite script.
I expect, that the default route for S&P is 3100+ by end of 2018.
Now let's see if the 'market influencers' nod in silence or will attempt to crash it early.
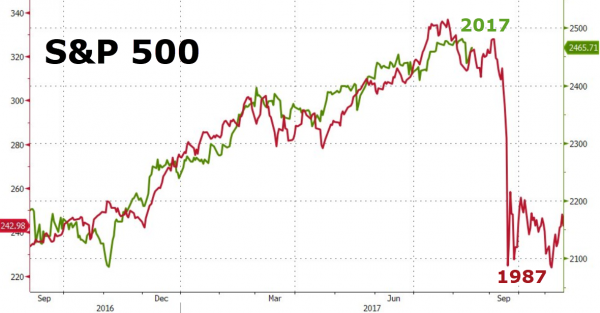
The main trend is up. As for suggestions for a '1987 repeat'... well...
My take, is it happened in 2015. That was the '1987 flash crash' repeat.
Here is what zh says on it:
From 15 august 2017:
Source: http://www.zerohedge.com/news/2017-08-15/bonds-bullion-black-gold-slump-dollar-jumps-most-3-months
From 10 october 2017:

Source: http://www.zerohedge.com/news/2017-10-10/bonds-bitcoin-bullion-bid-dow-bounces-back-another-record-high
Now, if it does happen, remember... tomorrow is Friday the 13th...
If there is a drop, my take is not going to make more than a 5% down move.
If it does and they're right(zh), for once, with the crash...
Then, the s&p would drop 10-20% in the next week or end of month, and that would mean...
S&P to 2250 or 2000. It is likely to hold support above 2000.
If markets crash below 2000, it's game over. But, until there, there will be:
-circuit breakers
-market halts
-and all the other crazy stuff
My take, that is planned at the mid to end of 2018, if not 2019 and beyond.
Despite all the 'fear' created out there(which is a good warning sign), like this:
http://www.zerohedge.com/news/2017-10-11/black-swan-anxiety-has-never-been-higher
This tells you that, if the banks sell you a 'crash product', it might mean you would have to think again...
...why they are doing it:
http://www.zerohedge.com/news/2017-10-11/goldman-allowing-its-clients-bet-next-financial-crisis
And to add further data, read this article:
http://www.zerohedge.com/news/2017-10-11/most-worrying-one-year-central-bank-liquidity-will-collapse-2-trillion-zero
It means, CB liquidity or it's 'stock buying' will start to unwind in Q1-Q3 of 2018, and stop at Q4 of 2018.
So, this means, in the end... that the major plan is, to simply, buy all stock rallies, backed by your own favorite Central Bank...
Until the end of 2018. And that fits with the 3100+ SPX price targets.
Will post charts for other indexes too.
To add one last article in regards to stocks and bonds bubbles/and investments, let's look at this article:
http://www.zerohedge.com/news/2017-10-11/and-another-record-hit-it-pretty-rare-emerging-markets-see-type-euphoria
To quote:
" For all "doom and gloom" predictions of an imminent crash in Emerging Markets (here and here, among many others), not only have these not materialized, but as of last week the average yield on corporate junk bonds issued by emerging markets dropped to 5.53% late last week, the lowest on record, according to the WSJ citing J.P. Morgan. Indicatively, two years ago, that yield was over 9%. "
To make this story short, EM bond yields have dropped and, there is a high demand for them, due to the fact that...
...The Central Banks nationalized their country's bonds, and some of them, especially government bonds, are doing negative yields. What it means, is that money looking for high returns will look to go into emerging markets, to buy products with a yield above 3, 5 and sometimes 10%.
Since most debt is doing a negative figure on YTM(Yield to maturity), people are looking to invest in Emerging markets, or...
...anything else that has enough Divident yield to give a decent return on investment.
Initially this was a post about Stocks and Indexes.
Of course, certain stocks have a very high P/E ratio. And despite this, they will continue to rise.(though this creates risk for a 20% crash)
The bond market it also now shifting to emerging markets. Question is, where else would money flow?
Well, some people would wish that Cryptocurrencies would drop in price, or that some would have bought 'lower'.
With less and less good returning investments, the search for yield will either push money into new stocks or...
More emerging market bonds or...
Cryptocurrencies...
Or, ...
Precious metals...
Palladium is up 40% ytd. That is a much better yield than those promissory bonds.
Let's put a performance-based dashboard to see how the metals are performing:
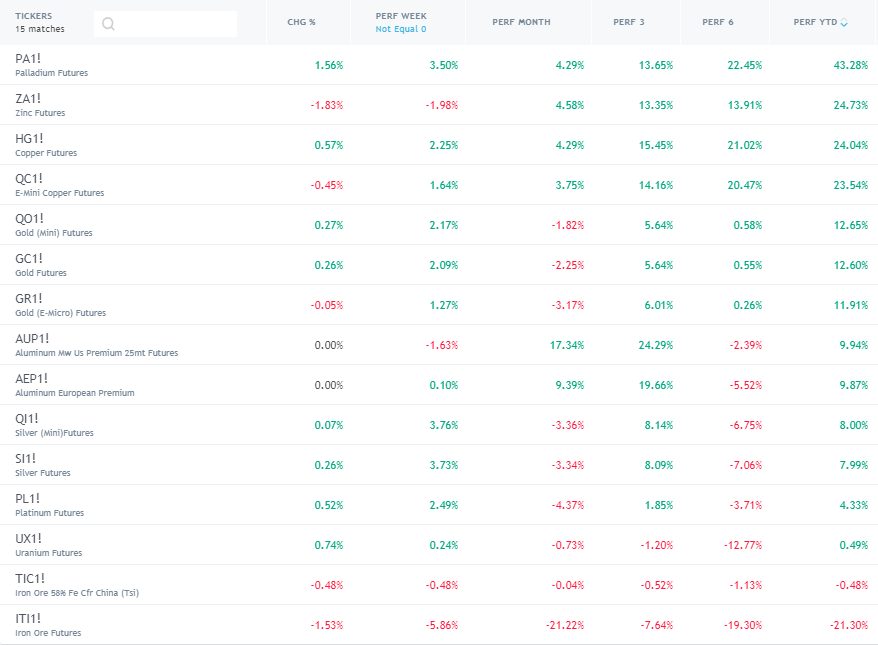
Palladium, followed by Zinc, then Copper and then Gold, lead the performance based returns this year.
A bond giving 5-10% yield a year, or a nice precious metal? The first helps emerging economies which is great.
The second is a way to protect wealth.
And now.
Let's put a chart for the S&P, which exemplifies, both the crash prices and the up move prices.
The author is favoring a 70% chance for the S&P to go north of 2500 by end of year 2018, with going as high as 3100-3200 for SPX. Also 3300 looks also to be a good price target for the S&P.
The S&P has value and net support anywhere above 2000, which now would be a 20+% drop from current highs.
The lowest estimate point for S&P, in case of a huge panic sell, be it caused by fear, or by huge selling pressure
Would be somewhere in the area of 1640.
Anything below, like 1200 or 1300...
The price would only go to that level in case of conflicts, wars and casualties in the majority of large firms.
The author estimates that such scenarios are quite improbable, despite the NK threat.
The main view is that, markets will go up and it will probably be quiet in the years 2017-2018, where...
Stocks would go up and... no down moves with a drawdown higher than 5% in the stock market.
Still, here is the chart, of the levels, in case something else happens:
If anything bad happens on some weird days(like friday the 13th), the drawdown would't be higher than 5%.
5% down - 2400 spx target
10% down - 2290 spx target
17% down - 2100 spx target
21% down - 2000 spx target
Upmoves expected:
5.6% up - 2700 spx target
12.7% up - 2880 spx target
24.32% up - 3180 spx target
So, for year end, expect either sideways activity, or another surge, to another record highs, all the way to 2700 spx.
And that would be 5% up from current highs.
Even if US Prez. has in it's books, a market crash, the whole market will still be positive from the spx 2100 since he was elected.
That means, after a 50% upmove, any crash totaling 20% or even 30% may end the year positive, when he was elected.
Despite the market already being in a bubble territory, thanks to stimulus from the Central Banks.
Which, at this point in time, is somewhat a good thing, keeping people employed.
The time will probably come for a reset and a new way of thinking, but that is not built in months, but in years of hard work.
This ends the commentary, and summarizes the view of the stock market.
If the numbers are correct, then NK will only be threatened, and let alone or...
It will be dealt with so swiftly that no shock would ever come to any other nation.
The first possibility being the one with highest probability.
The one where a bad thing would happen in NK, though, can create a drawdown of 20% in either stock markets...
Or any other asset class with direct and indirect impact/correlation with NK.
At this point in time, that would be the SPX, the VIX, the gold, silver and other precious metals and possibly...
The prices of grains and then energies(crude and gas).
Now let's put some charts in regards to other stock market indexes.
For example the DAX:
Dax has a chance to go to 13.3k by end of 2017.
Dax can go as high as 15k or 15.1k by the end of 2018.
Potential lows are 12.3k, 11.5k and 10k.
Hang Seng, major cliff range:
Upmoves can go as high as 30k this year, or even 31k, with a high point of 35k in the next year.
For Nikkei:
At least 21k by end of year, 25k by end of next year and, who knows, new all time highs in the next 4 years(it's over (3)9000 )?
For Gold
Gold is a slow barbarous relic. It may yield 20% in the next 2 years, which is decent.
There is also a 10% chance it might go to 2000$ an ounce by 2020, however the first possibility is more likely
If gold goes below 1000$/ounce, the price will continue a slow but sure downtrend, where...
...Probably a lot of 'goldbugs' will sell and quit their gold...
For Silver
If silver goes up, 20$ this year, and can range from 25-50$ next year.
If not, 12$ a silver ounce.
For Palladium
Can go to 1500$ per ounce, considering current momentum.
But first it must go above 1000$/ounce, and hold the price for a while.
If it continues north, it might reach 1500$/ounce by 2018.
For Bitcoin
Grains and Softs (Corn, Wheat, Soybean, Cotton, Sugar, Coffee, Cocoa, Orange Juice)...
Are influenced by production supply and market demand and are not influenced by USD value.
Unlike Metals and sometimes Crude Oil.
So what it means, the Grains and Softs can go up only if there is too much supply or demand.
As for Crude oil, both the charts and the markets are anticipating an upmove for the coming months.
So what does this mean?
USD weakness - > First, precious metals go up...
Then Crude Oil goes up -> Higher costs for agriculture production
Grains and Softs go up, months or sometimes years after Crude fluctuated in price.
So to summarize.
USD strength/weakness -> immediate impact in currencies and precious metals
delayed impact in crude oil -> much more delayed impact in grains, softs
And a chart in Crude Oil
The expected values are:
-A rise of 20% from current prices, to 60$ per barrel by the end of 2018 or 2019;
-A rise of 45% to 73$ per barrel by the end of 2018 or 2019;
-A rise of 60% to 80$ per barrel by the end of 2018 or 2019;
-A huge rise of 150% as seen in the period of 2008 to 2009, when crude gained from 50$ to 147$ per barrel in the course of 547 days( an estimate of 1 year and a half (which has exactly 547.5 days)). That rise had a 191% rise in oil price.
If a similar move happens to Crude oil, while it will go to a panic buying, it may reach 125$ per barrel or higher, but will likely fall soon after because... The production would increase a lot, to sell that much oil at such high prices.
Oil might have 5-10 years market dominance until alternatives will take it's market share. Until then...
Comparison between strongest currencies:
Bitcoin in EUR
Bitcoin in USD
EURCZK (CZK strongest European Currency)
EURCZK weekly
EURUSD weekly, targets for 2017 and 2018:
Targets for 2018:
Highest probability(35%), EURUSD up 7%-10% from current highs, at 1.27-1.30;
Second highest probability(30%), EURUSD keeping range at 1.13-1.20
Third highest probability(15%), EURUSD going as high as 14-18% up, to 1.35-1.40;
Fourth highest probability(10%) EURUSD going as high as 18%-25% up, to 1.40-1.50;
Fifth highest probability(9%), EURUSD losing between 4%-8% of it's value, at a range of 1.08-1.13;
Sixth highest probability(1%), EURUSD hits parity(1.00), loses 15% of it's value.
EUR up against XAU
XAUEUR down 13.5% from current highs
CZK being stronger, up against XAU
But Palladium even stronger:
Even stronger than CZK:
Strongest currencies of 2017:
->Cryptocurrency -> Bitcoin;
->Precious Metal -> Palladium;
->Exotic -> (European currency), CZK;
->Major -> EUR
->(Gold, Silver, Platinum)
Dashboard of Exotics, this month, with Indexes and commodities, lower:
Trades for the last quarter of 2017:
Favoring: long stock indexes, sell only if they crash more than 5% and below key levels
Favoring: mild long on precious metals, to hedge dollar weakness
Favoring: Possibly short volatility, and with gold long, can be a good hedge. It might only work when shorting the highs.
Trades for 2018:
Favoring long stock indexes, with expected 5-10% crash once or twice.
Favoring longs on precious metals, only if they close green on daily/weekly/monthly levels.
Favoring crude oil longs, if indeed they cut off production, announce some aramco ipo and oher investments.
And of course, if BTC continues to close green, then up.
BTC is shrouded with uncertainty, with 'volatility' and strong price moves.
Expected that gains will reduce it's exponentiality in 2018, but there are always opportunities for surprises.
This analysis is both for 2017 and 2018.
No market crashes(over 20% drawdown) are expected by default. If that is the default, will it stay as the default?