Litecoin triangle correction, if completed, Bull signal $LTC #LTC #BTC
Litecoin is attempting to complete its correction.
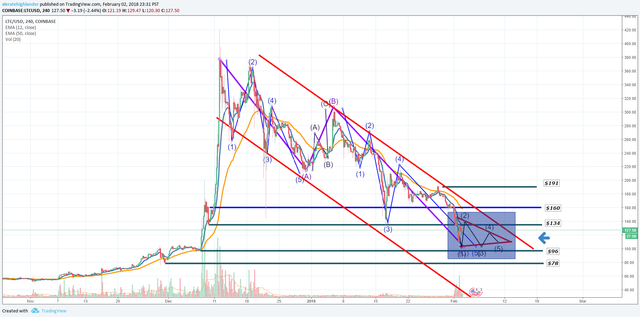
Please see below graph.
Litecoin is beginning to show a triangle/diagonal wedge, if completed this will give a "Bull Signal" and mark the end of the correction. A traingle/diagonal wedge typically only shows up in subwave #5 of the C wave correction.
Now the confusing part, stay with me... There is usually a set of waves within a set of waves within a set of waves... Still with me? If so, you'll see clearly that it is demonstrating a 5 wave correction within the 5th wave of the 3 wave correction... Yeah I know, its easier to see then to explain, please see chart below.
Here is the catch... Volume has to match the waves within the triangle. The opening jaw has to show a large amount of volume which is evident in the chart, but please keep an eye on it, the volume have to reduce as the wave approach the tip of the small end of the triangle. Only if this happen, will this triangle correction be valid.
If it is valid, then it is a clear Bull Indicator, there will be a growth toward the next resistance level. If the volume does not match the triangle then the triangle is not a bull indicator but could be something else or signal another drop.
Buy ladder should be set-up once there is a clear indication that there will be a rise upward for the next trend.
It quite amazes me that bitcoin, litecoin and xrp looks identical in the charts.
Litecoin Chart 2.2.18 (11:45 P.M. PST)