Litecoin (LTC) passing the sky - Chart art TA
Here is an artistic chart of LTC/USD pair, inspired by a great artist on Twitter, manwithnoname49.
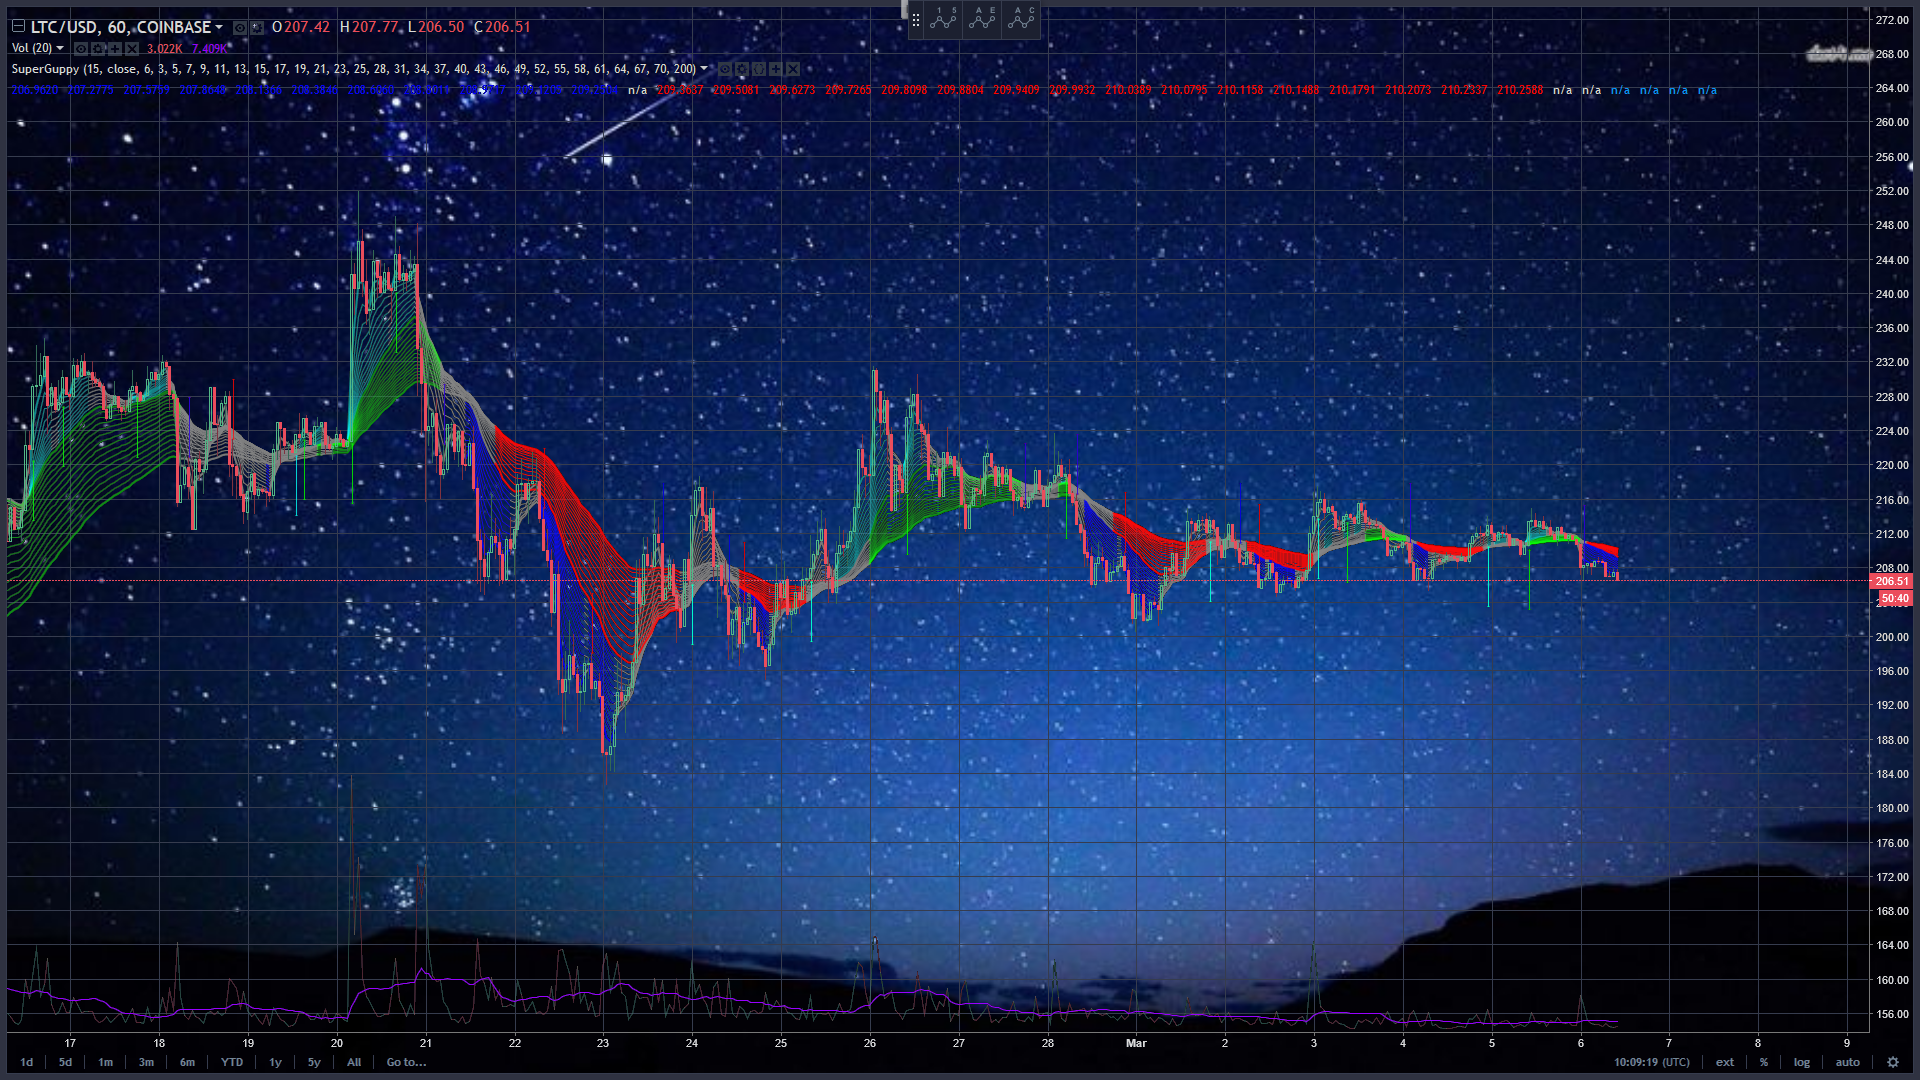
Price is going sideways, and the Superguppy show great uncertainty between trader group and investors group.
Red Investors group is compressed and tells agreement on price and value, and it is the blue short term traders who decide whereprice moves short term.
A compression in traders group could result in an outbreak up, vs a widening dragging it down.
Today turning down from yesterdays up, and a wider blue tells we are going down today.
Volume is low, telling investors hold their LTC.
These are just my thoughts, not a trading advice.
If you have another view on this post your welcome to discuss and post your charts in the comments.
*If you'd like my technical analysis on a coin, please ask in the comments. *

Comments are highly appreciated, and please
upvote, resteem and follow me if you profit or otherwise enjoy my posts !
If you feel like buying me a beer,just send me some STEEM :)
Think of all the possibilities with that... Just imagine, you paste the chart on a picture of the moon! 🌕LTC is mooning!
Yes, I'm trying to catch the sentiment here :)
This post has received a 0.13 % upvote from @drotto thanks to: @banjo.