Which part of the chart don't you understand? The chart was mostly explained in Part 1, Part 2 (this post) doesn't explain the chart because it's explained in Part 1. Or did you read Part 1 and still not understand? Then I'd appreciate some feedback on what made you lost so I can try to explain better
I read ur part 1. I still dont understand the chart. Which part I dont understand? I don't know where to start. I dont understand everything but I think its my problem. The chart looks like 2 heads going for a race...then I am lost.
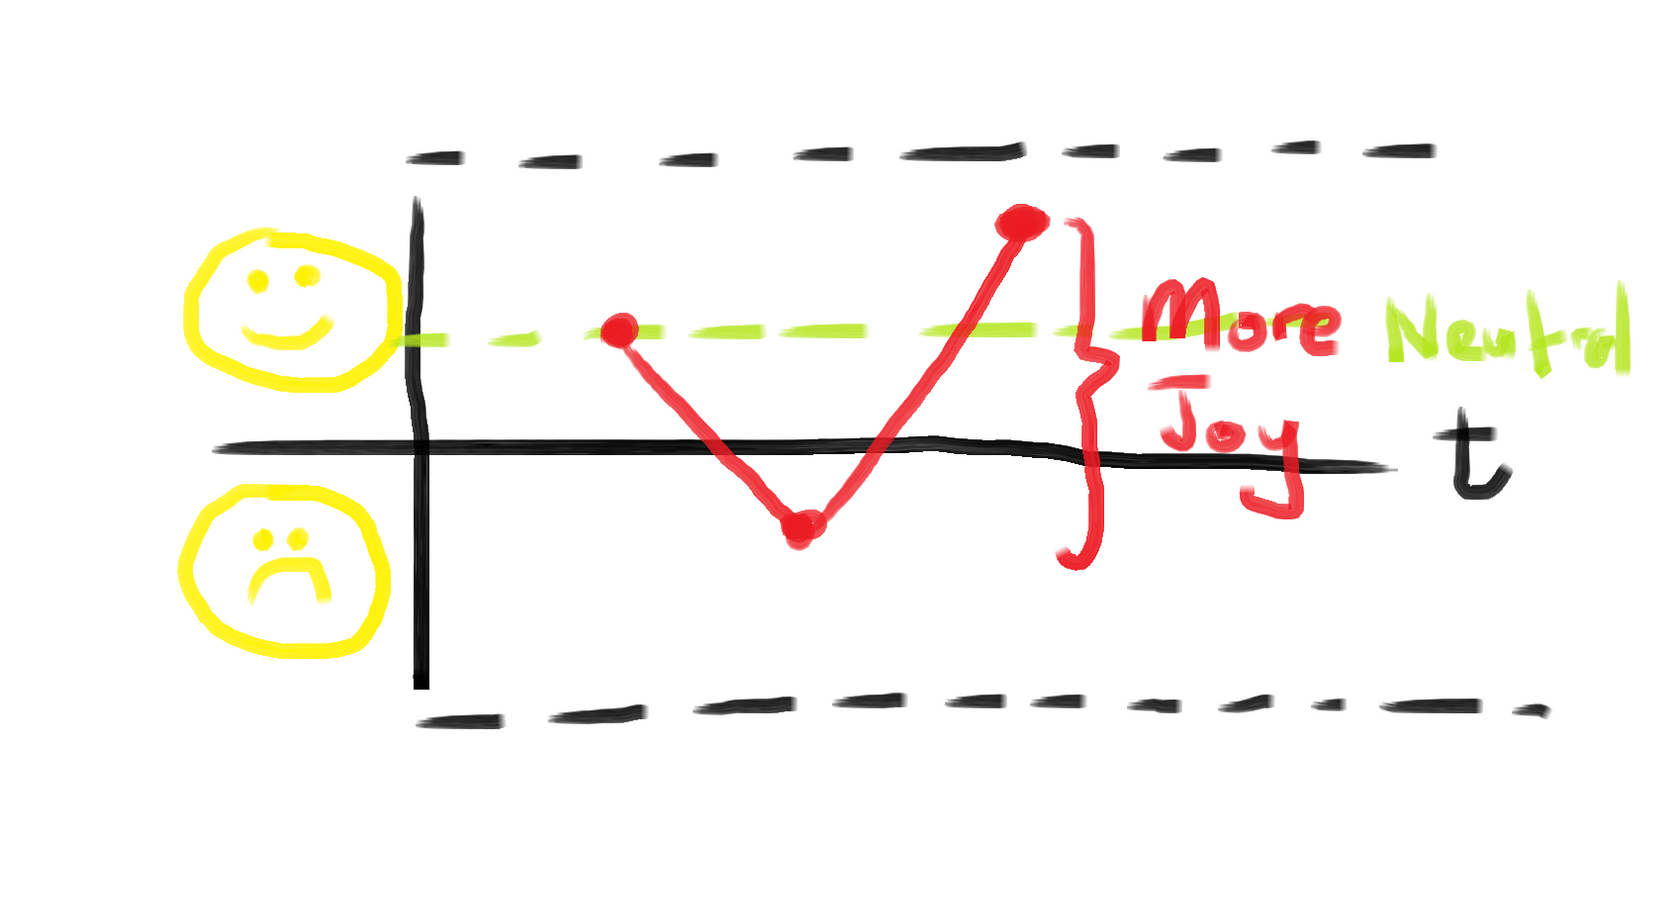
Oops, I guess I always assumed people would know what an x-y graph is. The vertical line represents happiness, if its positive (top) you are happy, when negative (bottom) you are negative. The horizontal line represents time with past (left), present (current point) and future (right). The overall chart represents the change of your happiness over time.
So you read it from left to right. In the graph below for example, it starts with the first point where you are of a neutral happiness, your usual state. The next point is lower because something bad happened and you became sad. The last point shoots up because something joyful happens and you are back to being more happy. Hopefully, that clarifies things a bit?
Which part of the chart don't you understand? The chart was mostly explained in Part 1, Part 2 (this post) doesn't explain the chart because it's explained in Part 1. Or did you read Part 1 and still not understand? Then I'd appreciate some feedback on what made you lost so I can try to explain better
I read ur part 1. I still dont understand the chart. Which part I dont understand? I don't know where to start. I dont understand everything but I think its my problem. The chart looks like 2 heads going for a race...then I am lost.
Oops, I guess I always assumed people would know what an x-y graph is. The vertical line represents happiness, if its positive (top) you are happy, when negative (bottom) you are negative. The horizontal line represents time with past (left), present (current point) and future (right). The overall chart represents the change of your happiness over time.
So you read it from left to right. In the graph below for example, it starts with the first point where you are of a neutral happiness, your usual state. The next point is lower because something bad happened and you became sad. The last point shoots up because something joyful happens and you are back to being more happy. Hopefully, that clarifies things a bit?
I guess that is why i am a photographer and not into mathematics...cheers bro.