You are viewing a single comment's thread from:
RE: Shower Thoughts | Graphical Interpretation of Happiness, Joy and Love - Part 2
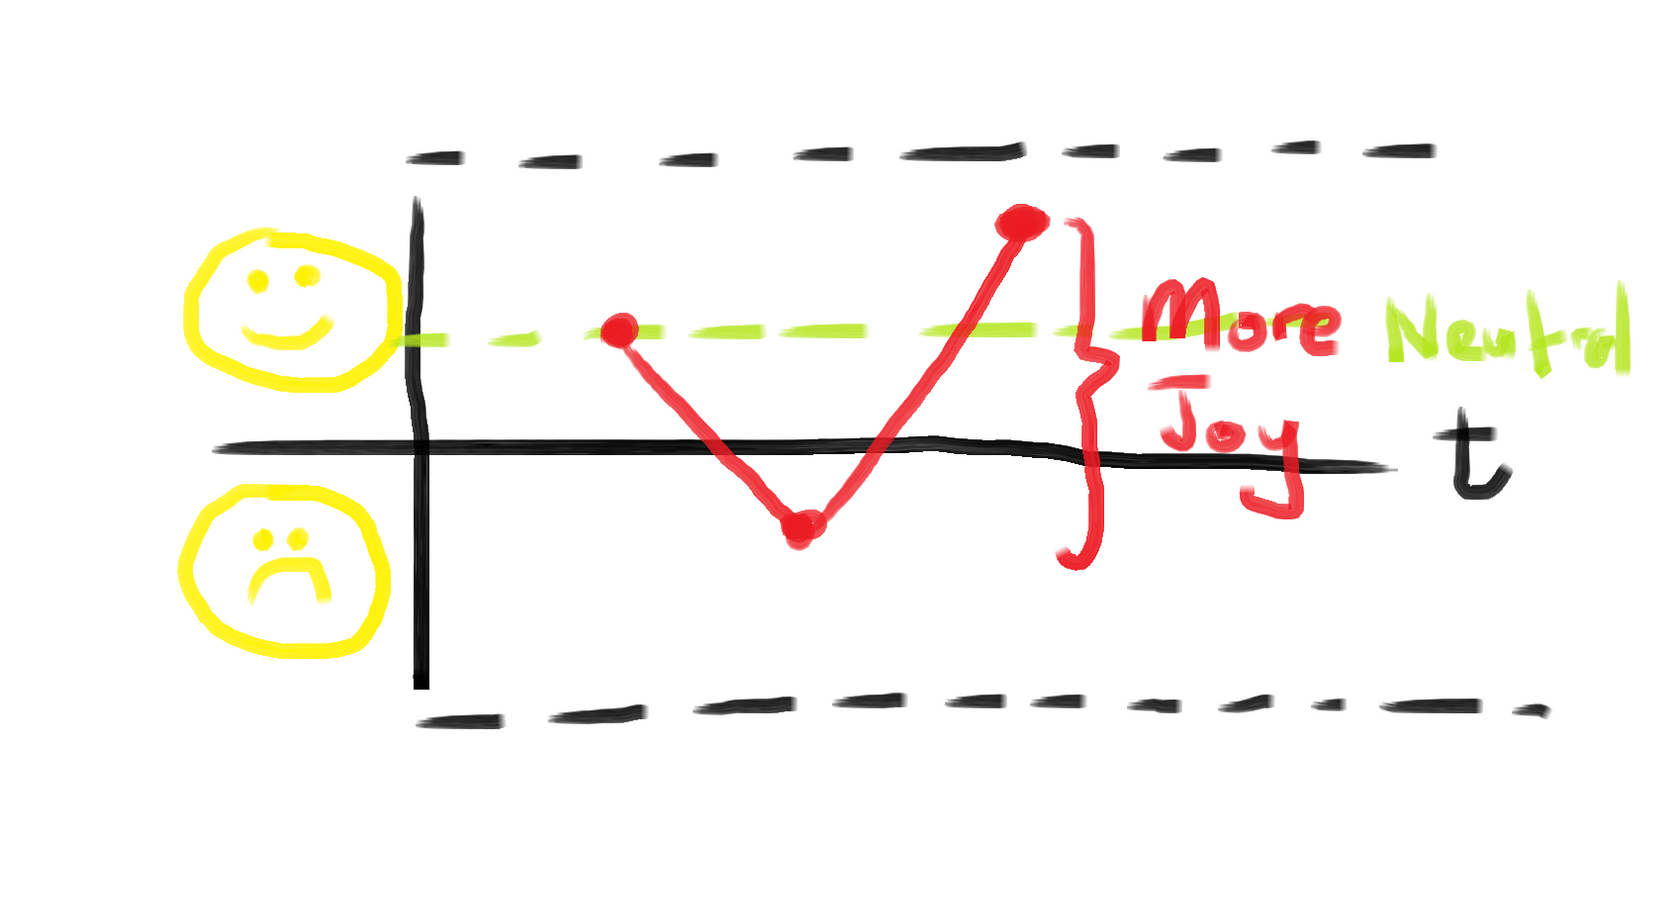
Oops, I guess I always assumed people would know what an x-y graph is. The vertical line represents happiness, if its positive (top) you are happy, when negative (bottom) you are negative. The horizontal line represents time with past (left), present (current point) and future (right). The overall chart represents the change of your happiness over time.
So you read it from left to right. In the graph below for example, it starts with the first point where you are of a neutral happiness, your usual state. The next point is lower because something bad happened and you became sad. The last point shoots up because something joyful happens and you are back to being more happy. Hopefully, that clarifies things a bit?
I guess that is why i am a photographer and not into mathematics...cheers bro.