BNBUSDT Technical Analysis

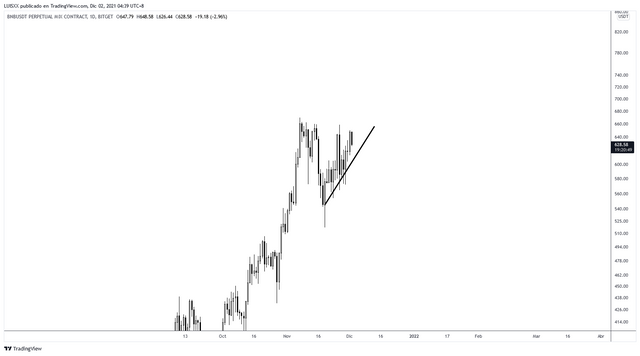
BNB within the 1D timeframe is performing a bullish triangle, the support line has remained strong in the last 2 weeks.

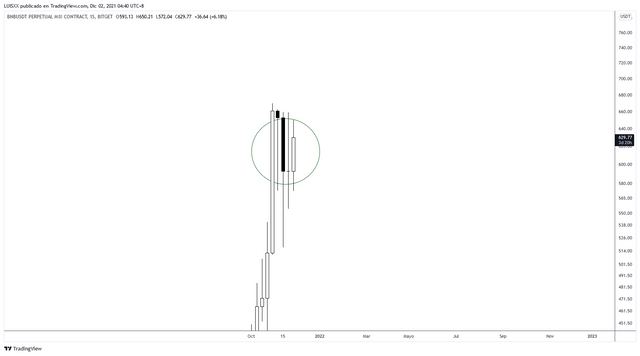
In the image above we can see how within the 1W timeframe the price is forming an excellent bullish candlestick pattern, the previous close was a doji with strong accumulation, if the current candle closes with good volume, we should see the price reach or exceed $700 for the next few weeks with clear expectations to look for higher price levels in the medium term.
Sort: Trending
[-]
successgr.with (74) 3 years ago
