IOTA! Missed it or Can you still hop on ? Weekly Technical Analysis
Keep your IOTA Wallets safe! Joking Aside , IOTA has seen a significant price increase following a bearish trend! We can say that an Uptrend has already started ( Am guessing the whole market is)!
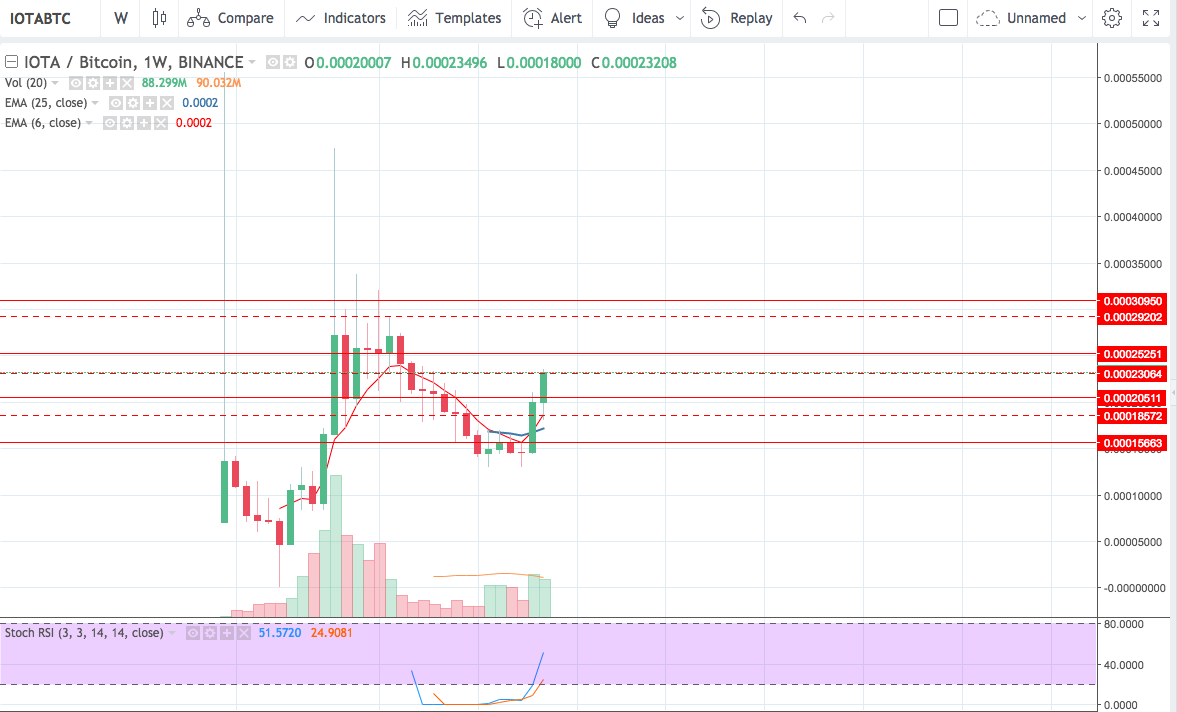
On the Weekly Chart: As it is clearly obvious, IOTA closed above both moving Last week and confirmed the same this week ( weekly candle closing in a couple of hours). Coupled with an upward crossing on the stochastic indicator we can easily say that IOTA is just waking up! Now before we get too hyped, you may look at the illustrated support/resistance lines ( full line = Strong; interrupted line = weak). ATM IOTA is trading at a weekly resistance of 0.00023 ; whether it closes above or beyond, remember, 90% of the times, candles touch the closest moving average, the touching could be your best entry point!
On the Daily Chart:
Price is expected to test a strong resistance level which once acted as a support @0.00025251 should it easily pass above 0.00023. This could be your target! Looking at historic data from the daily chart, there seems to have been a lot of ranging between the support/resistance of 0.00025251 and 0.0003095 and the same is expected once this price is reached! This is the point where you have to pause and ask if IOTA is on any major projects that may drive its value higher than previous highs, if not, go look for your next coin!
