The horrible trap of the low interest rate environment
Since 2008, the global economy has spiralled downwards as a result of the property and stock markets declining sharply, sparked by the collapse of the UK and US property markets. The contagion led to effects being felt across the globe, with stock markets around the world similarly falling some 15-50% in a matter of months. The collapse of several major banks and financial institutions, with the most prominent being Lehman Brothers, Countrywide Financial, Bear Stearns and Northern Rock Building Society, fears of a systemic crisis led to central banks around the world scrambling to "rescue" the system.
The figure below shows the Dow Jones Industrial Index from 2000-2018:
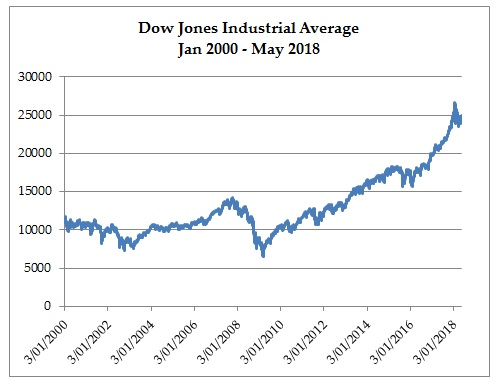
While the decline looks minor in the context of how the index has recovered since 2009, back then the index declined over 50% from 14 1964 on 9th October 2007 to 6 547 on 9th March 2009.
The US Federal Reserve (which is as Federal as the Federal Express, and has no reserves) stepped in and reduced the interest rate to 0-0.25%. The figure below shows the US Federal Reserve Funds Rate from 2000-2018:
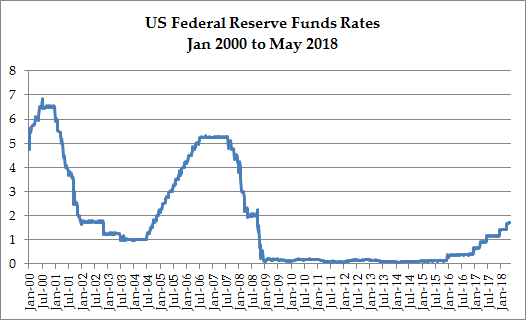
The virtually zero interest rate policy was meant to spur lending and economic activity, as they believed that the systemic crisis where banks refused to lend to each other would lead to no liquidity in the system. In layman's terms, what they really did was to say to everyone that there is no point saving up, go borrow and spend your way out of the crisis.
To the general public, this policy was too complicated for them to understand. The central bankers, government officials and bank executives knew this all too well. They know that as long as the asset markets are not dropping like a stone, they may be put at ease. The media can report to the general public that the markets are no longer tanking and then problem solved.
To solve the problem at hand, they decided to prop up the markets by forcing savings into the fray. The interest rate would be dropped to virtually 0% through increasing the supply of currency into the market through buying up the bad debts from banks and financial institutions, these bad debts being the failed bond, stock and property investments.
As we can see, the markets have recovered over the past nine years. In the case of the Dow Jones, it has exceeded the pre-crash peak by almost 90%.
Problem solved and we are out of the woods? Not quite.
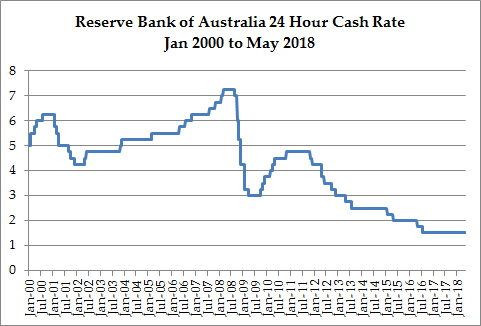
For Australia, the Reserve Bank of Australia has similarly reduced interest rates to an almost historical low in late 2008, beginning to raise rates again from 2010 to late 2011 to cool off the mining investment boom, but reducing interest rates thereafter as the mining investment boom turned into a bust. We are currently at a historical low of 1.5%. The figure below shows its history:
The Australian stock market declined over 50% over the period from 1st November 2007 when it stood at 6 829 points to 9th March 2009 when it stood at 3155 points. The figure below shows the stock index over the 2000-2018 period:
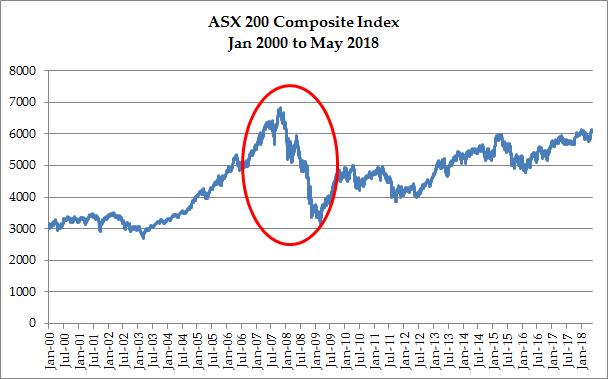
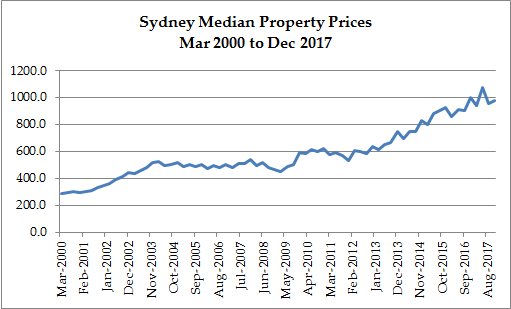
Unlike the US stock markets, the recovery in the Australian stock markets has not been as pronounced as the index has not returned to the pre-crash peak, falling short by around 10%. The reason is the property market has been where the cash has been invested at a greater magnitude. The figure below shows the Sydney property market median price level from March 2000 to December 2017:
Many miss the link between low interest rates with the current trends and levels in asset prices, be it bonds, stocks, properties, etc. The low interest rate environment pushes cash out of savings accounts, which are paying less than 3% p.a. and hence reaps no long term compound interest effect, into higher risk assets in order to capture potentially high returns. The figure below shows simply the difference between simple and compound interest at 2% p.a. and 7% p.a. over different time horizons:
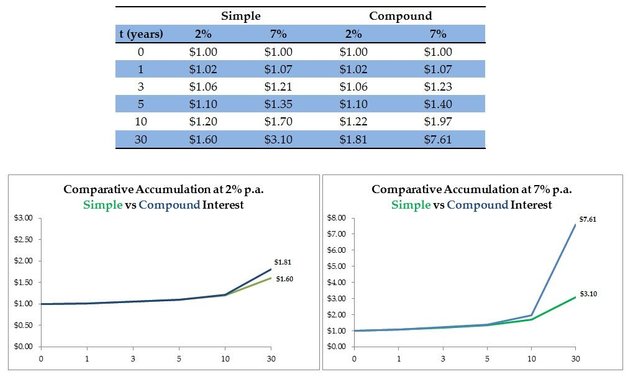
Clearly, when you are saving up at a rate of interest of 2% p.a., you can kiss goodbye your dream of having a lot to spend in your retirement. Whereas, if the interest rate is 7% p.a. (the rate of return normally assumed for long-term investment projections), this is possible. In fact, the motivation for saving when young was the prospect of compound interest working on your savings so you can reap the long-term rewards. Government officials, financial advisors, university lecturers of finance, media pundits and even the mug in the pub held to that belief, having assumed in their mind that their investment returns were going to be moderate to high. Unfortunately, reality shows us this is no longer the case.
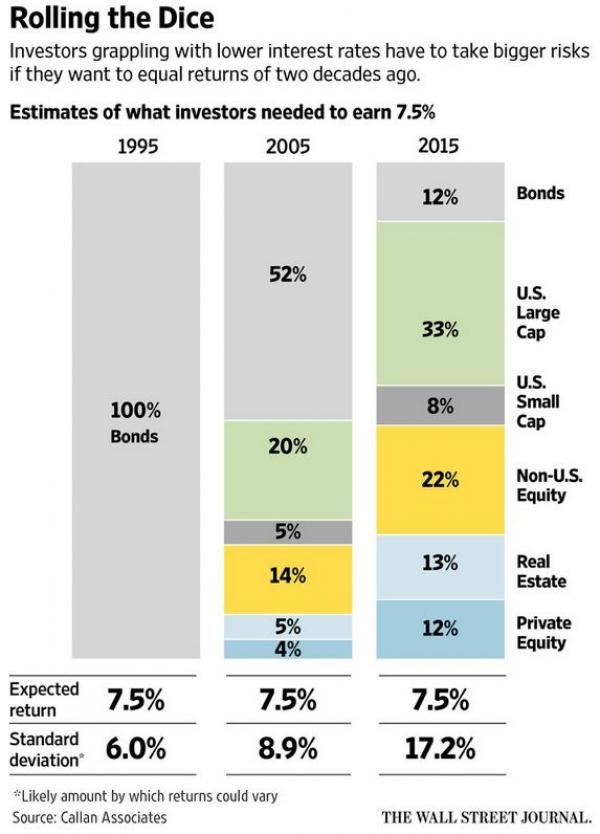
Recall the commonly accepted wisdom of higher risk leads to higher expected returns. Back in 2015, an article shows that to earn a return of 7.5% p.a. which is generally accepted as being a level needed to increase wealth and purchasing power, the types of assets that form the typical portfolio to attain that goal has become increasingly more volatile. The move has been from cash and bonds in 1995, when the central banks had an interest rate of close to 6%, to a predominantly stock and real-estate portfolio in the current day and age. Now, how many individuals are willing to take such risk to earn this level of returns? And, how many would be able to bear the not-so-insignificant risk of losing on their investment?
What is also not disclosed to the public is that banks benefit greatly in a low interest rate environment as they earn the margin on lending to their customers at a higher rate while paying lower rates on savings deposits. In fact, on average, banks earn 3% p.a. margin on mortgages (they charge on average 5.5% p.a.) and as much as 9% p.a. on personal loans (they charge over 10% p.a.). Credit card loans can earn margins of over 15% p.a.! Is there no surprise that banks have reported increasing profit levels each financial year, despite having cried poor and raising the alarm that they may go broke back in 2008 if the governments do not rescue them?
The figure below shows the difference between what banks charge on mortgage loans in Australia and what they pay savers on 1 year term deposits from 1982-2017:
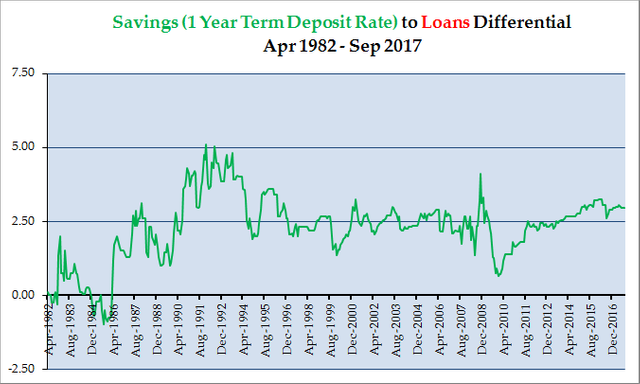
This should make your blood start simmering, yet it is a well kept secret hidden in plain sight from the public. You can find this data in the Reserve Bank of Australia website.
So, what do we do from here?
Take time to digest the information provided, review your financial position, start aggressively paying down your loans and consider alternative to saving up or building your wealth based on debt. The Robert Kiyosaki "good debt, bad debt" is not quite as rosy as it is made out to be. The banks have robbed many in broad daylight for too long.
Stay tuned for more. There are ways to get out of the hamster wheel of debt, debt and dreaming...
The YouTube video below was made last year and provides much more detail on what I have written in this post. You can also watch my other episodes too while you are at it.
In the meantime, God bless and take care!
Congratulations @sydneycontrarian! You have completed some achievement on Steemit and have been rewarded with new badge(s) :
Click on any badge to view your own Board of Honor on SteemitBoard.
For more information about SteemitBoard, click here
If you no longer want to receive notifications, reply to this comment with the word
STOP