Party Like It's 1964 - Part 3

One month ago I posted,
The Dow Jones Industrial Average DJIA rose 181 points on Friday, making it the ninth straight weekly gain for the Dow and the first time since 1964 that the DOW rose in the first 8 weeks of a calendar year.
This recovery since the Christmas lows is primarily due to Fed Powell succumbing to the Markets demands and putting its interest-rate policy on hold.

Two weeks ago I posted,
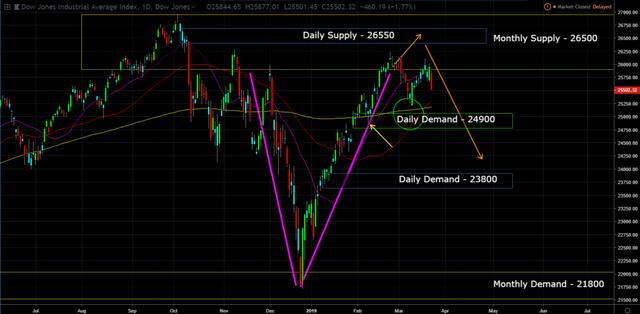
Now price find itself right above the 200 simple moving average. In addition, the 50 simple moving average is starting to point up, the starting basis for a golden cross. The golden cross is a candlestick pattern that is a bullish signal in which a relatively short-term moving average crosses above a long-term moving average, a sign that the uptrend is intact.
But as you know, moving average are lagging indicators. The best indicator is price action. Thus, I will be watching the the daily demand level at 24900, which has held up once already.

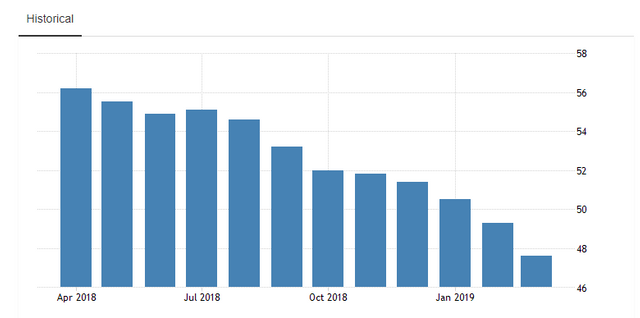
The eurozone continues to be weak as the PMI pointed to a further slowdown in activity during March.
Data firm IHS Markit Friday said its composite Purchasing Managers Index--a measure of activity in the manufacturing and services sectors--fell to 51.3 in March from 51.9 in February, a larger fall than the dip to 51.8 expected by economists.

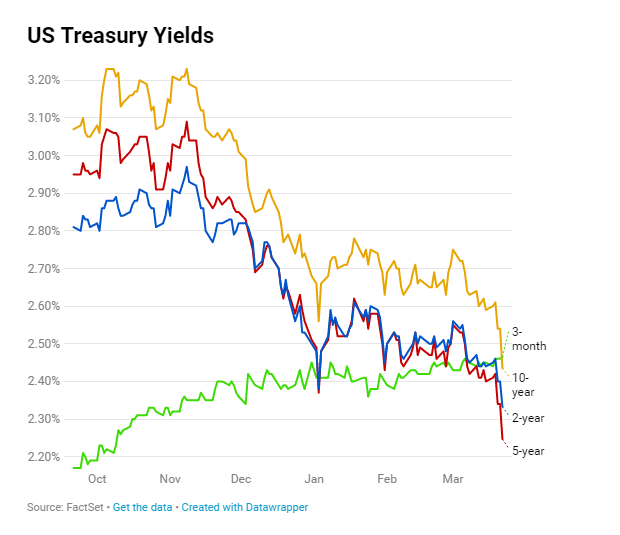
Also, Fed Powell left interest rates unchanged this past week, signaling that the US economy isn’t as strong as people thinks. And for the first time since 2007, the three month bill vs. the 10 year note inverted. On Friday, the 10-year note yield fell nearly 10 basis points to 2.434%, while the 3-month bill was down a single basis point to 2.462%.

When you throw these two ingredients into a pot and mix them up, you get a Dow Jones industrial average closed down 460.19 points, or about 1.8%, to 25,502. The daily demand at 24900 is still in play,

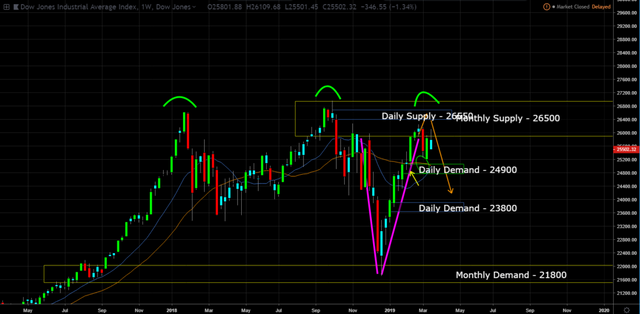
but now we are getting a situation where the fundamentals are catching up with the technicals. You want another technical, how about a triple top. A triple top pattern is a type of chart pattern used in technical analysis to predict the reversal of a long-term uptrend.

For new the US equity markets remain resilent, but it's just a matter of time before the dam burst.
This post is my personal opinion. I’m not a financial advisor, this isn't financial advise. Do your own research before making investment decisions.


Not sure I trust triple top formations very much... I think there is a potential of a “melt-up” type rally before it ultimately breaksdown before the recession or black swan event that will cause it.
Posted using Partiko iOS
It's quite possible, it will be a very interesting next 3-6 months.