The story behind the oil price rising from $40 to $60
There was a lot written about the oil price in recent years while we all could observe a spectacular price collapse from 100+ dollars per barrel in mid 2014 to just above 20 dollars in early 2016. Since then a lot has changed, but low prices were around for quite a while. The hard reality hit many companies of the oil supply chain and the statement "Lower for Longer" was heard from all corners of the oil and gas world. However, in 2017 the situation began to improve slowly. The big question is: what was the catalyst?
Influencing factors.
Oil is a special commodity and the prices are not only dependent on the supply-demand fundamentals. It is a big one and perhaps the only truly long-term factor, but politics play a major role in the game. Today we will leave this aspect aside and focus on hard data, as promised in my introduceyourself post.
Inventories.
Supply and demand is of course a standard and I will touch on it many times. However there is an interesting aspect of supply called stocks or inventories. Oil for many purposes is stored in the tanks allowing it to be used and distributed as required. These tanks are also used to store the oversupply. However if the storage is filled almost to the full capacity, dealing with more oil is becoming problematic. As a result, nobody wants oil and the price drops. This was the situation partially responsible for the price collapse and it seems that it will also help with recovery. The graph below shows the stock inventories in the U.S. with respect to 5 years min, max and mean values.
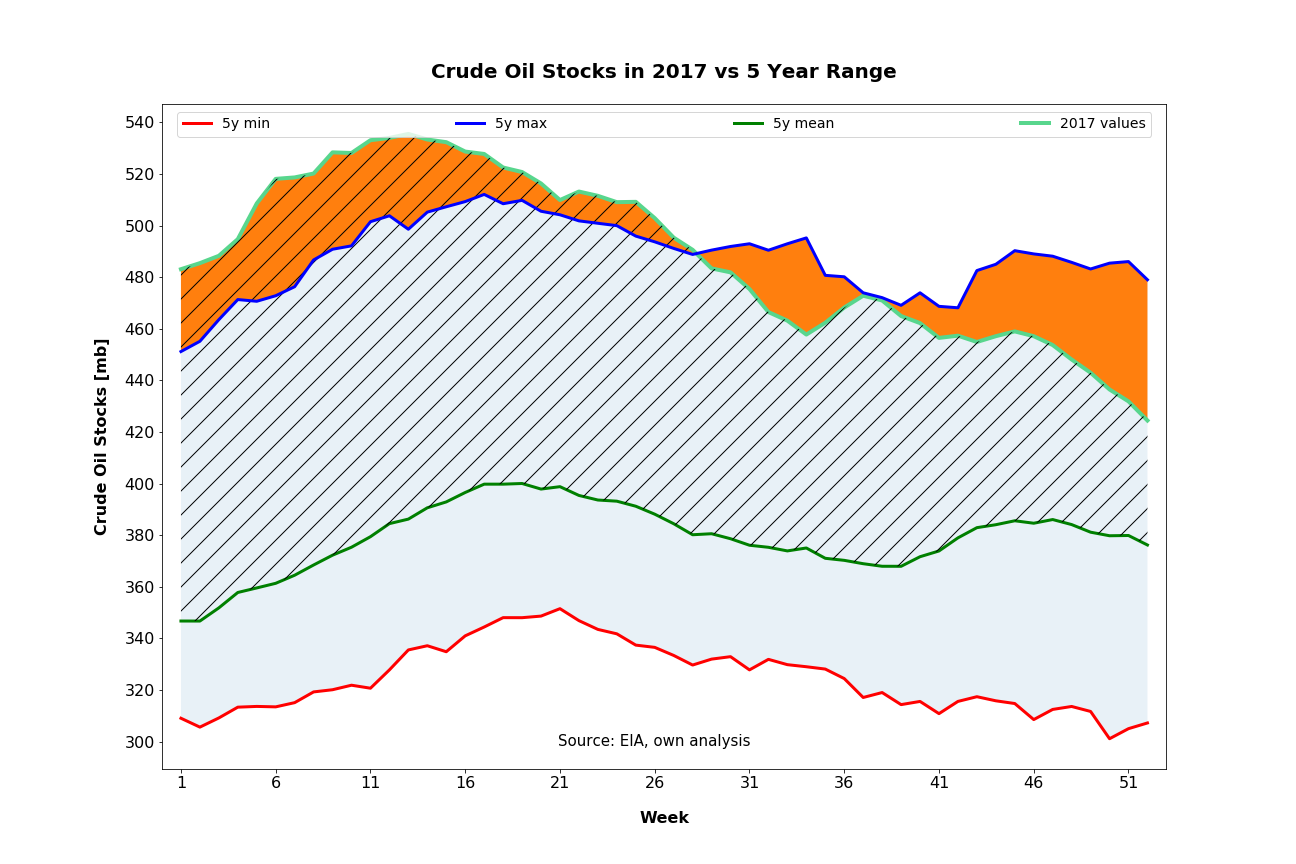
Until March-April 2017 the stocks were still growing and as a result there was not much supporting the price, except for OPEC talks about the production cuts. The stocks were high, but also were rising no more than normal for this time of the year. This trend, however, reversed in Q1/Q2 2017 and U.S. inventories began to decline. By the end of the year we could even observe an accelerated decline of stocks.
How did the price react?
The graph below shows the crude oil stocks (note: the axis is reversed) versus the WTI price.
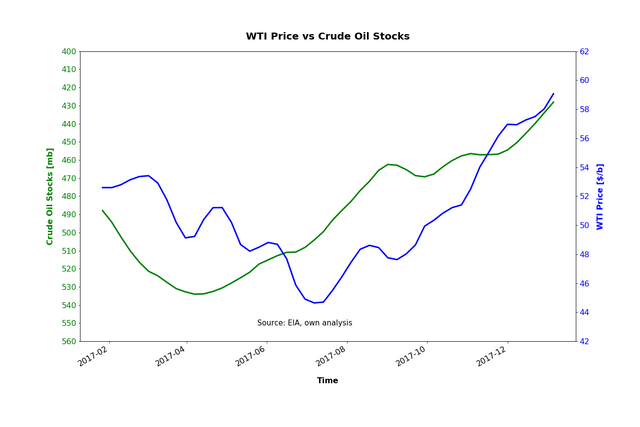
Looking at the data from EIA it can be observed that a 4 week moving average of weekly inventory levels can be a leading indicator for the price trend. The reversal in price followed the reversal in stocks with a couple of weeks delay. As always, the road is bumpy, but it is difficult to deny the relationship, at least at first glance.
Other aspects.
Are there other aspects? Of course. A good question is what caused such a decline in inventories. This is definitely something you will find here in the coming weeks or months. And of course data driven!
I would be happy to have an open discussion on the subject. Let me know what you think.
Hey, nice Blog ! I upvoted you and Iam Following you, and I will go on with upvoting!
Would you follow and upvote me too ! I does not cost you someting !