Value investing strategy that gives you a edge with "technical analysis" on stock market
To whom is this article for?
This for people that familiar with basic concepts of stock market investing but want a method to quickly analyze valuation and estimate return. This method will require use of computational tool. This will help you to value difficult stocks like Amazon with crazy PE value or simple dividend grow stocks like REITs. Demonstration is made with commercial software but there is no complex math involved so crafty persons can code them if they can access the data.
Basic philosophy of the method
Value investing is one of the more popular generic themes in traditional stock market investing. Warren Buffett is the most famous and one of the most successful value investors. Buy low and sell high is what all investor know is what must be done to hedge risk , but to execute that with accuracy needs something more than old saying you hear from everybody. Here is methodology that I have used successfully for couple of years. The following method utilizes following concepts
- Intrinsic value
- Historical valuation
- Analyst estimates
- Total return
- Mean reversion
In very short form the method utilizes historical valuation to find intrinsic value and compares that to analyst estimates which can be used to estimate total return when mean reversion occurs. Don’t worry! I will explain what that all means in detail in following chapters. By no means I claim that following method is my invention but more like accumulated information from many sources but mainly from Chuck Carnevale from seeking alpha.
Intrinsic value
Intrinsic value is a concept of value of stock that is something different from currently openly traded value. This is related to talk when people tell that stock is expensive of cheap as their own definition of intrinsic value is different from current stock price. So everybody can have their own intrinsic value for stock, hence the stock trading up or down. Instead of trying to 2nd guess how to best calculate stock valuation from quarterly statements and for example estimated future cash flow, I will show how to market can tell us from intrinsic value, and whether stock is trading up or below it. In the end it does not matter what ever I think of value of single stock as long as 90% of market does not think so and price gain never materializes. So we need to analyze how market values the company.
Historical valuation
Historical valuation is simple concept. We need to just draw how company stock has been value in history. Here is example of P/E value of S&P 500 index in history
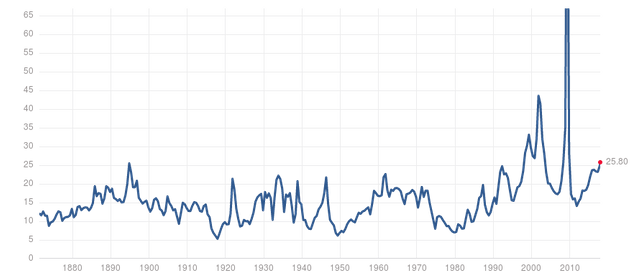
And similarly to other factors if they are meaningful for the stock. However I think this type of curves are not useful in raw format like this. I want to use averaged(over a period like 10 years) valuation curve and multiply it with relative change in earnings.
For example for McDonalds(MCD)
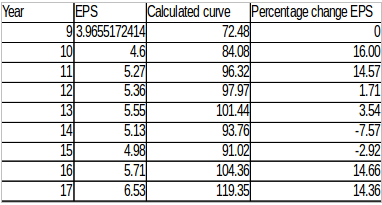
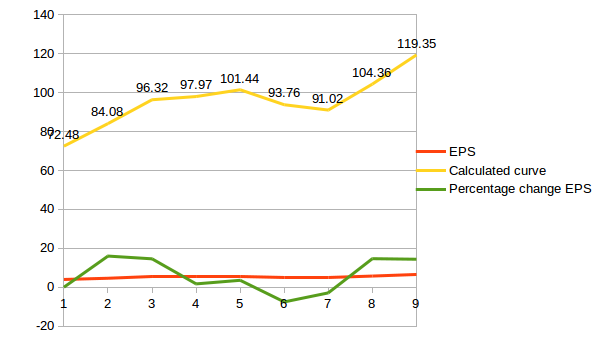
Calculated curve has starting point locked with average P/E ratio over the period.(18.2) The 2nd value is calculated by multiplying previous value with percentage change of EPS. Meaning that we assume that intrinsic value increases in fixed relation to change in earnings. And we get the yellow valuation curve like that. That curve is an intrinsic value candidate for the stock.
Analyst estimates
Analyst estimates are estimates of company earnings for the next year or so. It is almost controversial nowadays to propose that they are any use in real world investing as media and sentiment is heavily tilted against active share picking with index funds. But I say that most just use them wrong. Like if an analyst says company earnings will be this and share price this in one year, I wont buy a stock just because that. I want to know what is track record of the analyst with the stock, how long they have followed the stock etc…. But there is a better way used with this method. Input not one analyst opinion but all of them into mix and value the estimate based on track record of all of them. In sense, this method is a meta model as those analysts have their own models and methods for valuing the stock.
Total return
Total return is simple to understand. It is dividend return and stock price change over inspection period. Taxes can be used also in calculation to make comparison between dividend paying and non-dividend paying stocks more realistic.
Putting it all together with commercial software
Calculation in following examples are done with FastGraphs fundamentals analyzer software. A free trial version can be downloaded from https://www.fastgraphs.com
REIT stock example: AMT
American Tower Corporation is a communication tower operator and REIT.
Finding intrinsic value:
Now we need to investigate how investors value the company. For REITs it is usually funds from operations. For normal stocks earning development is the usual way. Here is earnings curve calculated like in MCD example previously:
Black curve is the stock price performance and there is no clear relation between that and earnings.
Following figure displays results with funds from operations P/FFO instead of earnings. Average P/FFO for the company was 20.9 over the period which is used to draw the blue line.
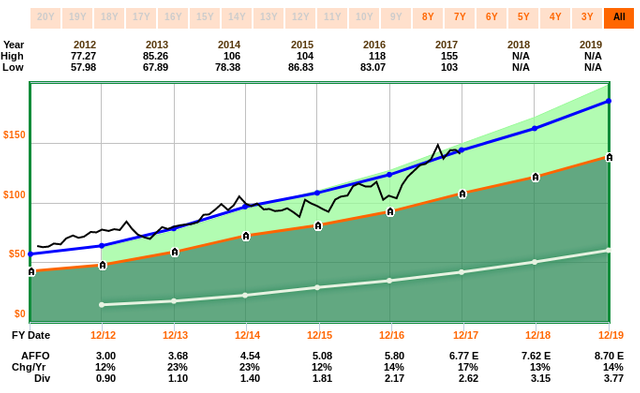
Now correlation is stronger. We however have less history of reported FFO. Company is now actually trading close to the blue line which means that it is close to intrinsic value. And now to estimate total return we can assume that stock price will close follow the blue curve taking account analyst estimates for following two years. And with dividends it comes to 16.6% / year:

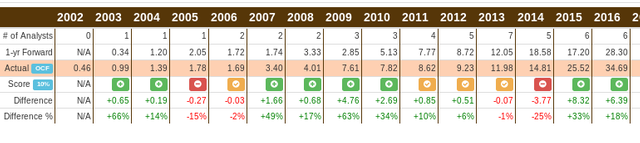
Analyst estimates are of course just estimates although aggregated values.
Fastgraphs also provides data on how accurate the estimates have been in history.
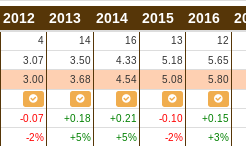
Estimates have been very accurate for this stock. This gives me good confidence on the total return estimate.
Growth stock example: AMZN
Amazon is a company we all know and it’s stock performance has been stellar. However company currently trades at price to earnings ratio of 272.6 which is pretty much nuts for most stocks. How on earth is market valuing the stock then?
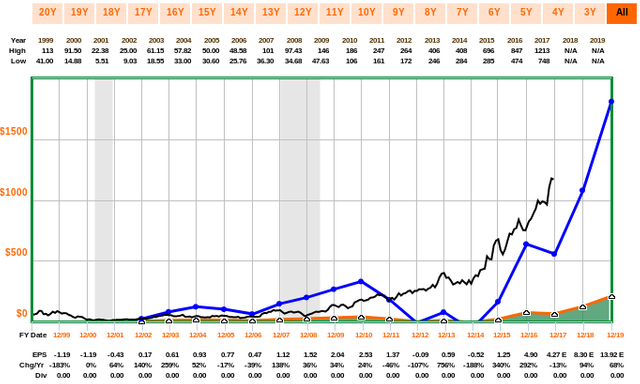
Price to earnings curve again does not correlate with stock performance very well. People are valuing the stock with cash flow performance as company is investing still heavily to growth.
Here is price to operative cash flow graph done similarly.
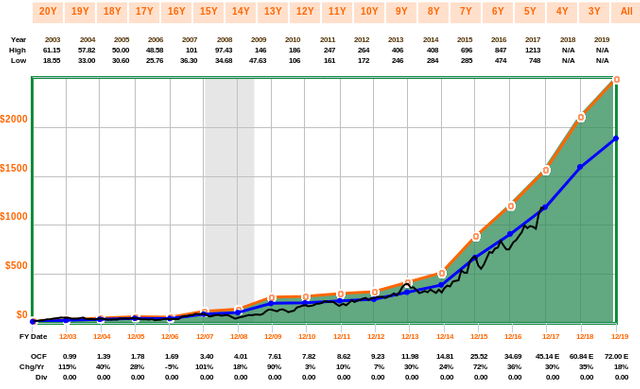
Now we have again found the intrinsic value for the stock that is respected by the market. Total return estimate gives us 26.6%.
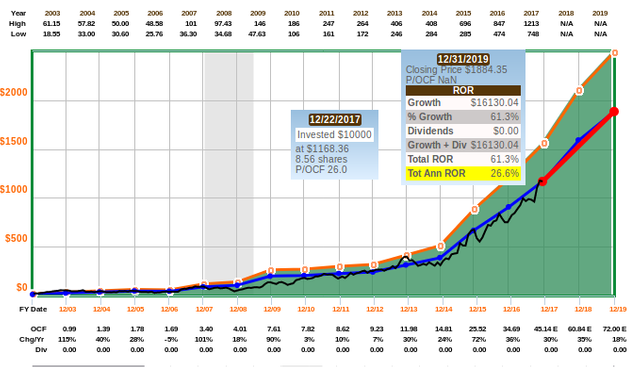
Amazon has been beating the estimates most of the time so nothing alarming.
But of course market can start demand earnings also from AMZN at some point.
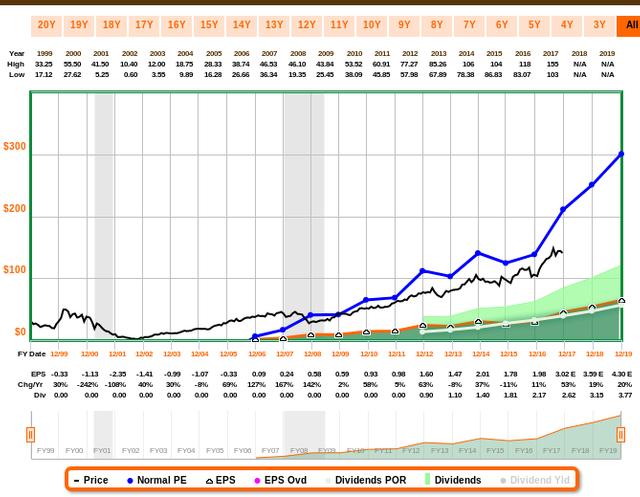
Normal dividend growth example: MCD
Let’s go back to McDonald's. Here is EPS curve:
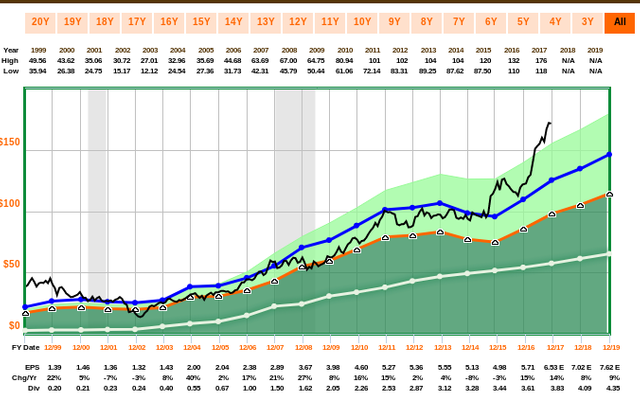
Until 2015, stock price follows the EPS curve but then something happens.
Is the cashflow?:
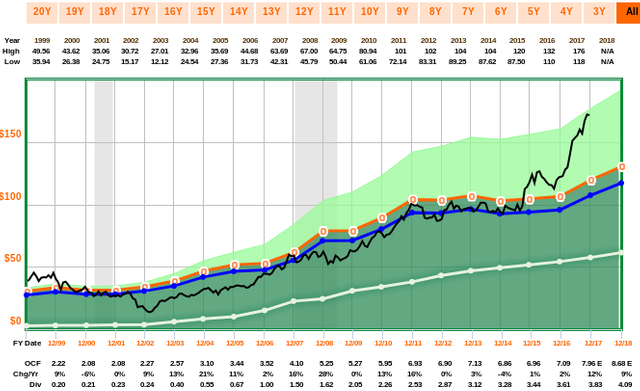
No.
There is no answer in the fundamentals. MCD just seems expensive. This story on seeking alpha by Josh Arnold thinks the same: goo.gl/Fqqzfj
If we calculate total return estimate using the EPS curves, it is not pretty:
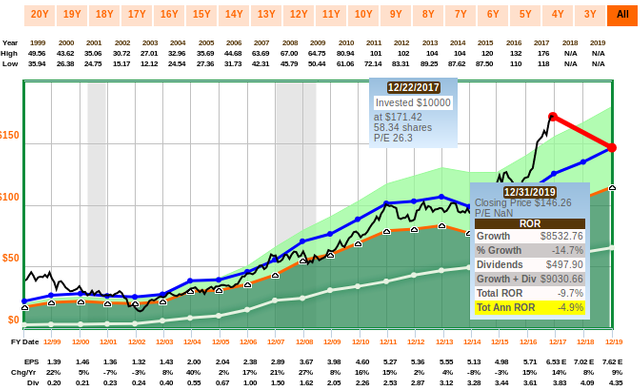
And if you are reading this in 2020, you can comment below how wrong I was with MCD:)
Conclusion
Some might say that this has nothing to do with technical analysis but I see this method combining both for more sound investment decisions. I like Fast Graphs for this analysis method. However there are other alternative also like oldschool value. I currently have basic version of the software but I might buy the whole deal next time to access to the screener also.
Stock research of the method in nutshell:
1) Find how market values the company and intrinsic value(earnings, FFO, Cash flow…. etc)
2) Compare current stock price to calculated normal valuation curve
3) Estimate total return with analyst estimates from purchase price
4) Evaluate the accuracy of with analysts track record
5) Do more research on the stock like read seeking alpha and company web page
6) Buy the stock if everything seems ok
Some more quick tips:
- Mortgage REITS are value with EPS instead of FFO/AFFO of normal REITs
- Business development companies and such high yielders are harder to evaluate with the method but dividend curves are best match how value them as high yielders pay most out anyway.
PS: I will write also some “how get started” stuff at some point but I wanted to start with a bang as basic stuff is everywhere :)
Congratulations @investing101! You have completed some achievement on Steemit and have been rewarded with new badge(s) :
Click on any badge to view your own Board of Honor on SteemitBoard.
For more information about SteemitBoard, click here
If you no longer want to receive notifications, reply to this comment with the word
STOP