S&P 500 | Historical Data March 22nd
SOURCE FOR EVERYTHING IN THIS POST IS FROM https://www.spytrader.net/
https://www.spytrader.net/single-post/2017/03/21/SP-500-Historical-Data-March-22nd

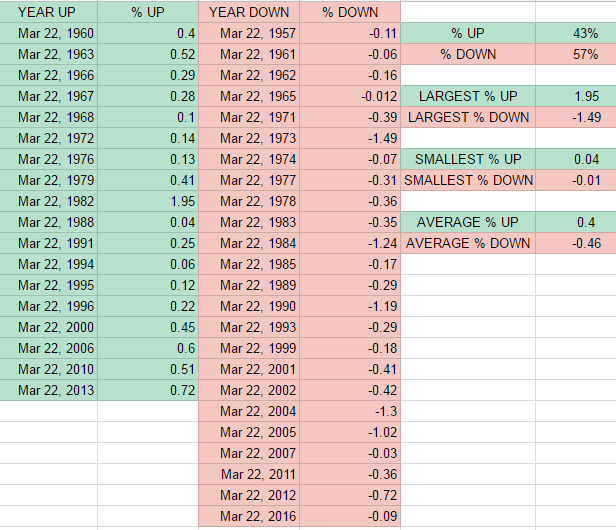
Below you will see every year the S&P 500 has traded on the 22nd of March since 1957. There have been 42 years this has happened and out of those 42 years is has been up 43% of the time and down 57%. The largest percent up was March 22nd 1982 with a 1.95% move up , and the largest percent down was March 22nd 1973 with a -1.49% move down. The smallest percent up was March 22nd 1960 with a move up of .04% , and the smallest percent down was March 22nd 1965 with a -.01%. The average percentage move up was .40% and the average percentage move down was -.46%.
I have permission from https://www.spytrader.net/ to post this.
Interesting indicator to follow, when trading snp. Not too sure about the profitability of this indicator tho. Maybe it would be more accurate to follow charts instead.
This post has been ranked within the top 80 most undervalued posts in the second half of Mar 21. We estimate that this post is undervalued by $4.96 as compared to a scenario in which every voter had an equal say.
See the full rankings and details in The Daily Tribune: Mar 21 - Part II. You can also read about some of our methodology, data analysis and technical details in our initial post.
If you are the author and would prefer not to receive these comments, simply reply "Stop" to this comment.