S&P 500 | Historical Data For April 6th
S&P 500 | Historical Data For April 6th
April 5, 2017 | SPYTRADER
https://www.spytrader.net/single-post/2017/04/05/SP-500-Historical-Data-For-April-6th
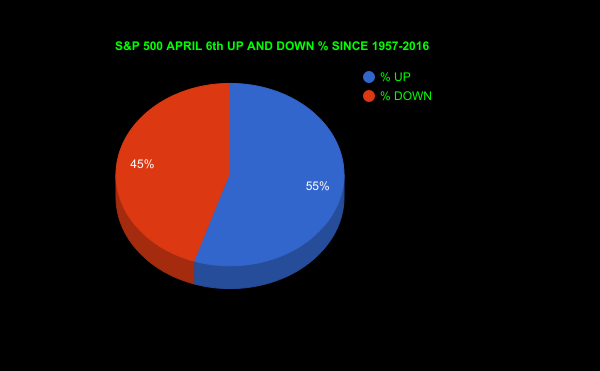
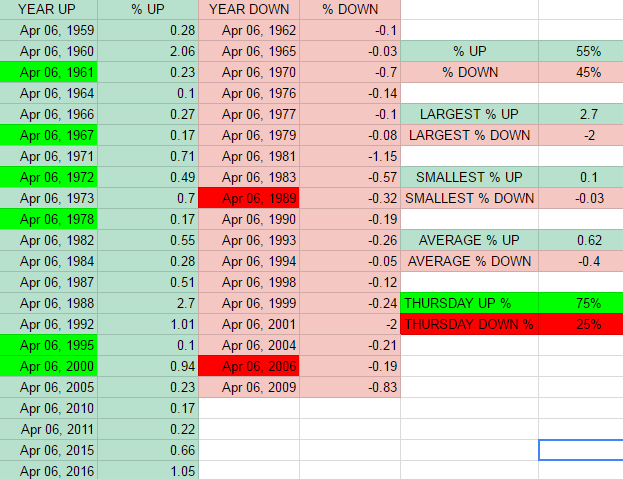
Above you will see every year the S&P 500 has traded on the 6th of April since 1957. There have been 40 years this has happened and out of those 40 years it has been up 55% of the time and down 45%.
The largest percent up was April 6th 1988 with a 2.70% move up , and the largest percent down was April 6th 2001 with a -2.00% move down.
The smallest percent up was April 6th 1964 and 1995 with a move up of .10% , and the smallest percent down was April 6th 1965 with a -.03%.
The average percentage move up was .62% and the average percentage move down was -.40%.
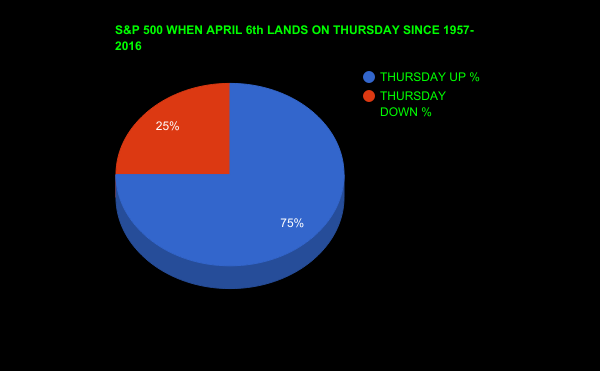
Lets take a deeper look. Since 1957 April 6th has landed on a Thursday 8 times and out of those 8 times 6 have been up days, that is 75%
SOURCE FOR EVERYTHING IN THIS POST IS FROM https://www.spytrader.net/
I have permission from https://www.spytrader.net/ to post this.
This post has been ranked within the top 80 most undervalued posts in the first half of Apr 06. We estimate that this post is undervalued by $0.16 as compared to a scenario in which every voter had an equal say.
See the full rankings and details in The Daily Tribune: Apr 06 - Part I. You can also read about some of our methodology, data analysis and technical details in our initial post.
If you are the author and would prefer not to receive these comments, simply reply "Stop" to this comment.