S&P 500 | Historical Data April 26th
S&P 500 | Historical Data For April 26th
April 25, 2017 | SPYTRADER
https://www.spytrader.net/single-post/2017/04/25/SP-500-Historical-Data-For-April-26th
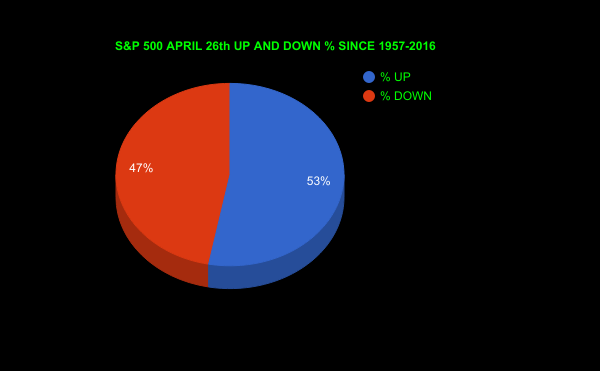
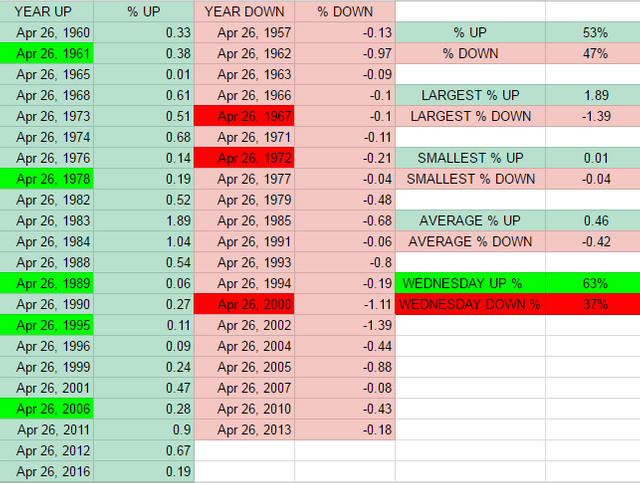
Above you will see every year the S&P 500 has traded on the 26th of April since 1957. There have been 42 years this has happened and out of those 42 years it has been up 53% of the time and down 47% , and one even.
The largest percent up was April 26th 1983 with a 1.89% move up , and the largest percent down was April 26th 2002 with a -1.39% move down.
The smallest percent up was April 26th 1965 with a move up of .01% , and the smallest percent down was April 26th 1977 with a -.04%.
The average percentage move up was .46% and the average percentage move down was -.42%.
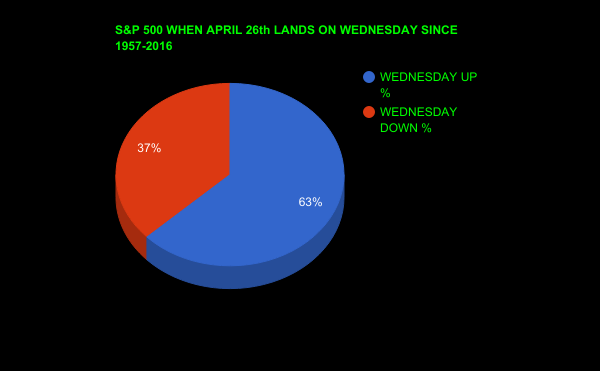
Lets take a deeper look. Since 1957 April 26th has landed on a Wednesday 8 times and out of those 8 times 5 have been up days, that is 63%
SOURCE FOR EVERYTHING IN THIS POST IS FROM https://www.spytrader.net/
I have permission from https://www.spytrader.net/ to post this.
Thanks for this info
No more @halo :( Just boring stats everyday now :( :( #sadhunter