S&P 500 Historical Data for March 27th
SOURCE FOR EVERYTHING IN THIS POST IS FROM https://www.spytrader.net/
https://www.spytrader.net/single-post/2017/03/24/SP-500-Historical-Data-for-March-27th
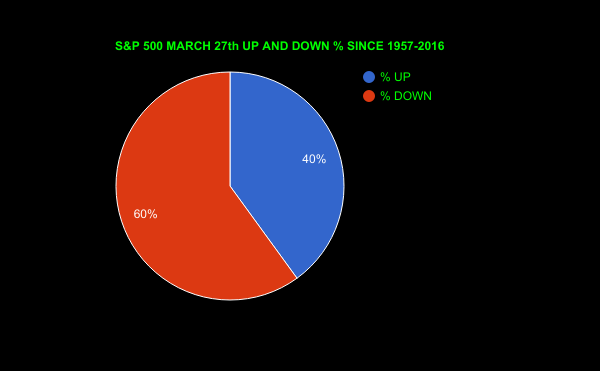
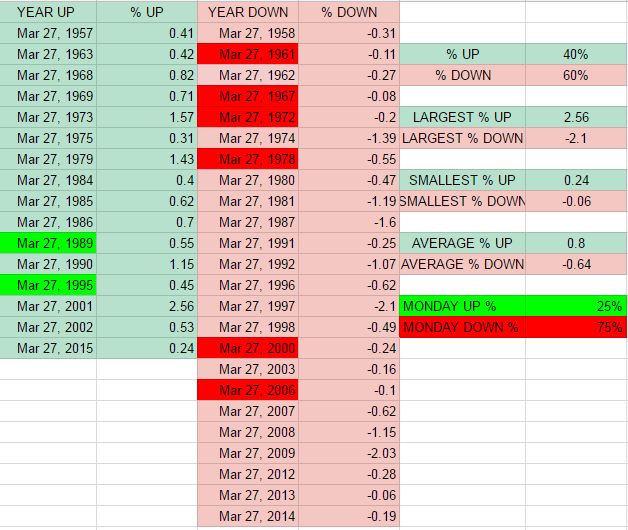
Above you will see every year the S&P 500 has traded on the 27th of March since 1957. There have been 40 years this has happened and out of those 40 years it has been up 40% of the time and down 60%.
The largest percent up was March 27th 1973 with a 2.56% move up , and the largest percent down was March 27th 1997 with a -2.10% move down.
The smallest percent up was March 27th 2015 with a move up of .24% , and the smallest percent down was March 27th 2013 with a -.06%.
The average percentage move up was .80% and the average percentage move down was -.64%.
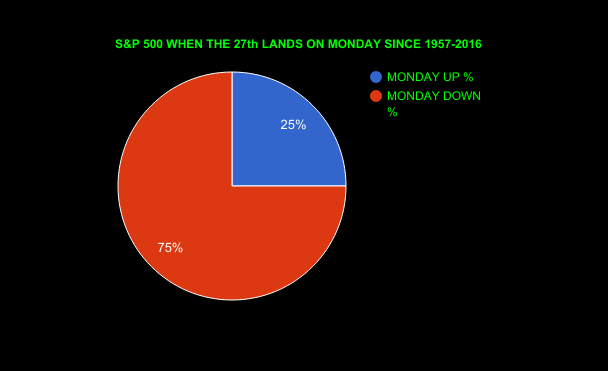
Lets take a deeper look. I have added something more to this S&P 500 historical data. Since 1957 March 27th has landed on a Monday 8 times and out of those 8 times 6 have been down days, that is 75%.
In the S&P historical data for March 24th I did not look at what percentage it was up and down on a Friday, but I just checked and it was 60% of the time it was up.
Maybe I jumped the gun when I posted last night about the S&P maybe having a huge day down today. I am going to sound like a broken record here, but the data looks pretty good for down day Monday.
I have permission from https://www.spytrader.net/ to post this.
Interesting info. I would bet on a down day too, with silver and gold rising!
I really enjoy these posts
love what you're doing here
thanks for info