S&P 500 Historical Data for March 23rd
SOURCE FOR EVERYTHING IN THIS POST IS FROM https://www.spytrader.net/
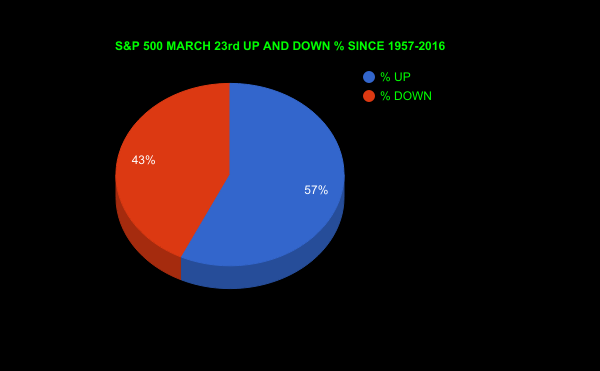
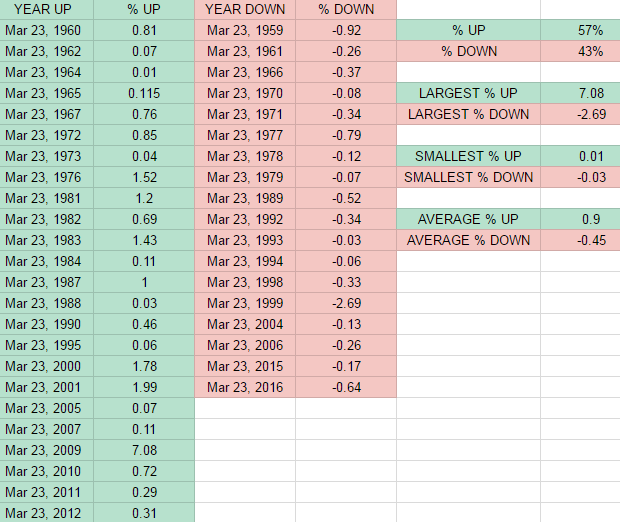
Below you will see every year the S&P 500 has traded on the 23rd of March since 1957. There have been 39 years this has happened and out of those 39 years is has been up 57% of the time and down 43%. The largest percent up was on March 23rd 2009 with a 7.08% move up , and the largest percent down was on March 23rd 1999 a -2.69% move down. The smallest percent up was on March 23rd 1964 with a move up of .01% , and the smallest percent down was on March 23rd 1993 with a -.03%. The average percentage move up was .90% and the average percentage move down was -.45%. Check out our alerts page to see what position we have taken.
I have permission from https://www.spytrader.net/ to post this.
This post has been ranked within the top 80 most undervalued posts in the first half of Mar 23. We estimate that this post is undervalued by $2.30 as compared to a scenario in which every voter had an equal say.
See the full rankings and details in The Daily Tribune: Mar 23 - Part I. You can also read about some of our methodology, data analysis and technical details in our initial post.
If you are the author and would prefer not to receive these comments, simply reply "Stop" to this comment.