TIB: Today I Bought (and Sold) - An Investors Journal #309 - US Index, US Tech Index, Fast Food, German Bank
Hedging time for US markets as we head toward "end of cycle". A novel way to go long a stock explored with MacDonald's due to report this week. And the first of the covered calls comes in with a nice premium as implied volatility rises

Portfolio News
Market Jitters
US markets opened higher but finished the day down with financials the biggest drag
The mood is not helped by the ongoing saga of Europe muddles as Italy tries to agree a budget that fits inside the European Union budget guidelines.
Hard going that is as the Italian government was elected to spend - not to cut spending. After several days of falling yields, we did see a reversal in Euribor rates.
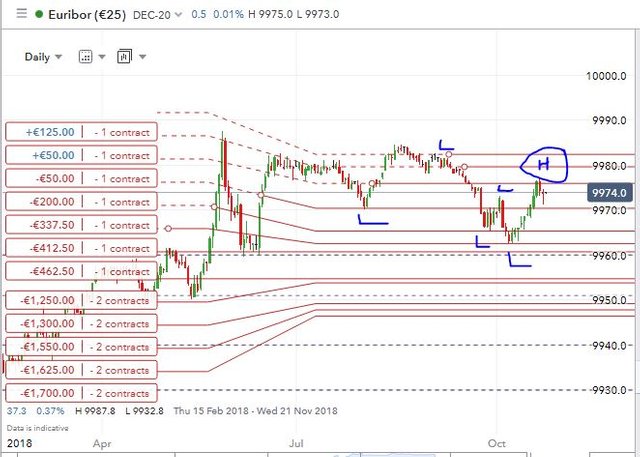
I do itch to trade each of these reversals but I do have enough positions in place (listed on the left of the chart, mostly under water) for the trade to come right for me. The chart has one concerning feature. After a series of lower lows and lower highs, we have just seen a break of the lower highs. I am not fussed as this high is lower than the last big consolidation zone we saw in June/July
Bought
McDonald's Corporation (MCD): US Fast Food. There has been a marked shift over the last few months in the market's appetite for risk. Where this has been noticeable in my portfolios has been in the relative outperformance of Consumer Staples (XLP) stocks and Pharmaceutical (XPH) stocks over the last quarter. The talking heads were talking about the upcoming earnings season and what their expectations were. One of the stock topics was MacDonald's which reports this week and the view what that MacDonald's could well get back to its 2018 highs around $180 on the back of this changed sentiment and continuing solid economic growth. First a quick chart to compare MacDonald's (black bars) to S&P500 (orange line) over the last 12 months.
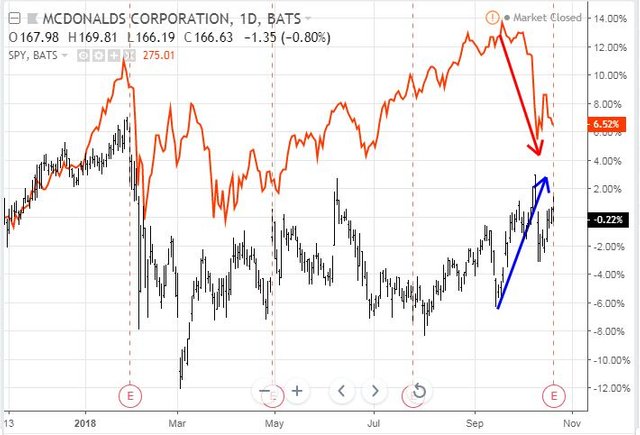
The key feature of the chart is the way MacDonald's has risen in the last 6 weeks or so while S&P500 has fallen. The trade idea is to be long MacDonald's in the event that its earnings are good and the re-rating of the S&P 500 continues.
There are a few standard ways to invest in the idea
- Buy the stock with a dividend yield of 2.8%
- Buy call options
- Buy a call spread with the sold call somewhere around those 2018 highs
One of the novel trade ideas presented was to sell an out-the-money put option a short time in the future going past earnings. This is the avenue I pursued with a closing price at trade time of $167.49, I sold a 165 strike put option with 2 months to expiry. The sold strike is 1.5% below the closing price and the sold premium of $4.47 is 2.7% of the close. The trade concept is that if one was happy to own MacDonald's now, wouldn't it be cool to be able to buy it at $165 (i.e., 2.7% cheaper than it is now)?
That is what happens if the market falls and/or earnings disappoint and price drops below $165 at expiry one gets to buy at $165. However, if price moves ahead and stays clear of $165 at expiry one keeps the sold premium. Of course the one bad outcome would be if the market reacts strongly to earnings and knocks the price back 10 or 15% and then one has a high entry price.
A quick look at the chart which shows the sold put as a red ray. I have cloned a few of the price reactions after earnings (the red arrows).
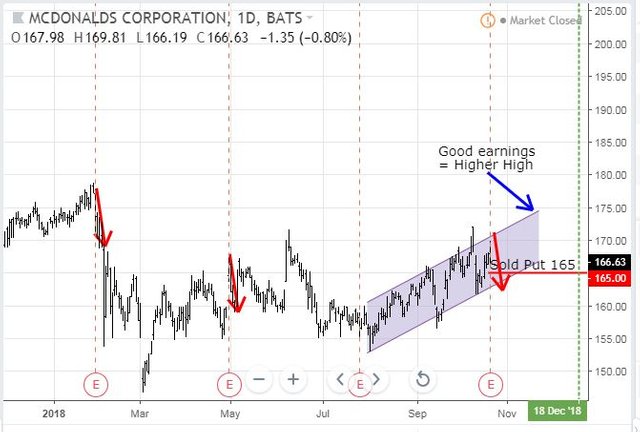
If we get a repeat of that, price could well drop below the sold put level. I have also drawn in the short term uptrend channel that price has been in. Earnings aside, price is equally likely to continue working its way to the top of the channel which would make a new high. Time will tell
Shorts
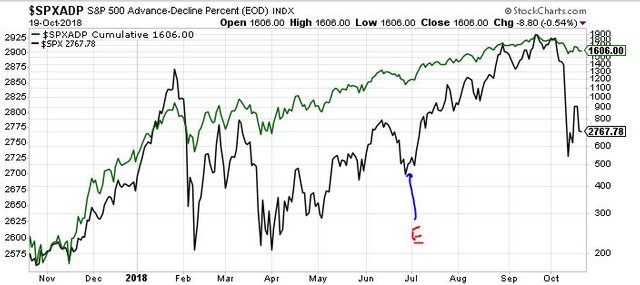
SPDR S&P 500 ETF (SPY): US Index. The talking heads have been talking about hedging trades a fair bit. After losing out on my last hedging trade on S&P 500, I revisited the charts and decided to have another go using bear put spreads on S&P 500 and Nasdaq. The key chart for me was the updated S&P 500 compared to its cumulative Advance Decline Line. The ADL has made two lower lows and is telling me that the risk of the market turning over has increased. (See TIB308). Here is the chart again (ADL is the green line).
Like last time, I went out 3 months and bought a 276/262 bear put spread covering the potential of a 5% market drop. Trade size was 4 contracts which gives me cover this time of 5% of the portfolios the hedge is applied to. I scoped this back a bit because I did increase gold mining hedge trades over the last two weeks.
With a net premium of $4.38, this offers a maximum potential return of 220% if price drops 5% or more in the next 3 months. Let's see how it looks on the charts which shows the bought put (276) as red ray and the sold put (262) as a blue ray with the expiry date the dotted green line on the right margin.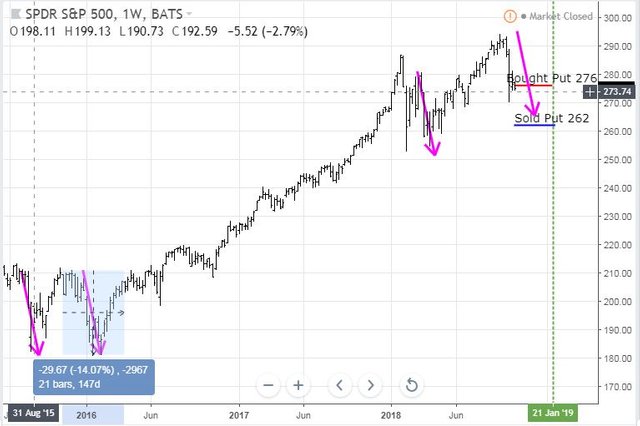
I have cloned 3 recent selloffs as price scenarios (they are about 14% each) and applied those to the current situation. A completion to that pattern will bring the trade to maximum profit.
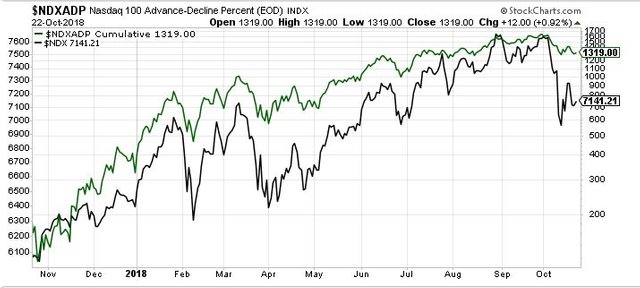
Invesco Nasdaq QQQ Trust (QQQ): US Tech Index. A key part of the selloff in the markets has been profit taking on technology stocks. The big concern is that we could see reduced guidance from tech companies in the upcoming earnings season which will be penalised heavily. I added a shorter term bear put spread trade to cover the earnings season buying a November 2018 173/160 bear put spread. I did not check the Nasdaq ADL when I made the trade as I had an idea what it would look like. Here it is and it looks mightily the same as S&P 500 - ADL has made lower highs and lower lows after turning over.
Let's see how the trade looks on the charts which shows the bought put (173) as red ray and the sold put (160) as a blue ray with the expiry date the dotted green line.
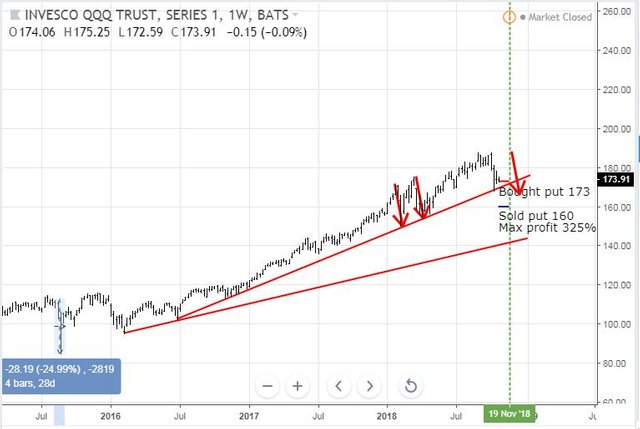
We have seen three selloffs in the last 9 months (red arrows) of around 12.5% each. Price needs to do a little more than that to make this trade fully profitable. The move would need to more like the July 2015 spike down to reach full potential. All it needs is a few days down like that and I can exit the trade. Trade was set up for a net premium of $3.06 which offers 325% return for 7.5% drop in 4 weeks.
Income Trades
Only one covered call trade set up. I wanted to see how the US market traded before setting up new trades for November expiry
Commerzbank AG (CBK.DE): German Bank. Sold November 2018 strike 9.2 calls for 1.84% premium (2.08% to purchase price). Closing price €8.68 (lower than last month). Price needs to move another 6.0% to reach the sold strike (tighter than last month). Should price pass the sold strike I book a 20% capital gain. Income to date amounts to 38% of purchase cost.
Cryptocurency
Bitcoin (BTCUSD): Price range for the day was $57 (0.9% of the high). While the price volatility was very low, price did want to make its way down to the short term support line (the fluoro green line I drew in yesterday)
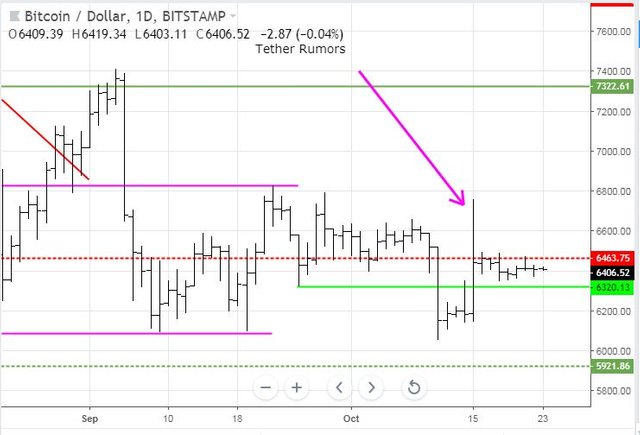
Days like this are good for the nerves. Price is certainly poising for something big. The momentum indicators are not giving any clues on direction.
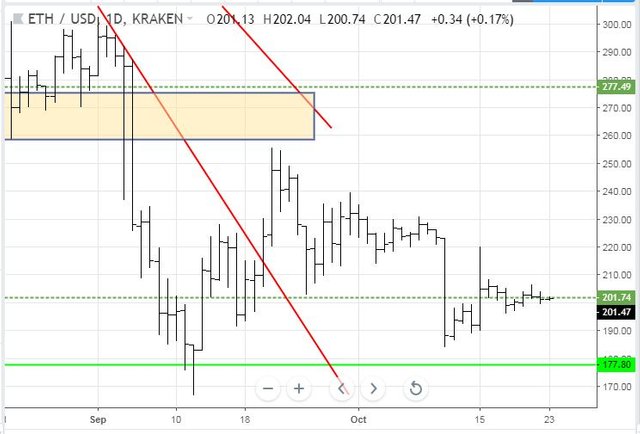
Ethereum (ETHUSD): Price range for the day was $2 (1% of the high). Price could not trade closer to the horizontal level trading $1 each side of the line all day.
CryptoBots
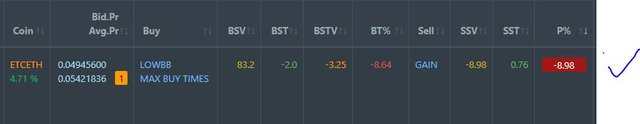
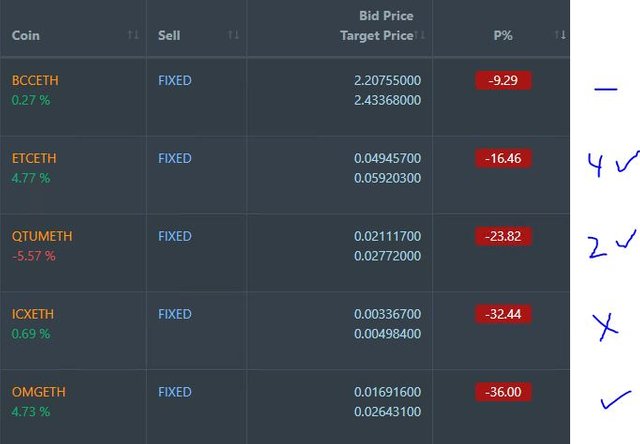
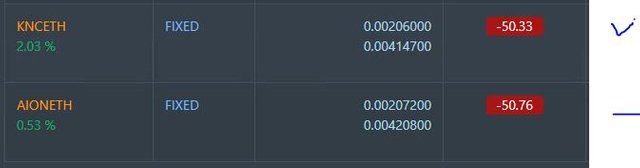
Outsourced Bot No closed trades. (221 closed trades). Problem children stayed at 18 coins. (>10% down) - ETH (-69%), ZEC (-64%), DASH (-68%), LTC (-52%), BTS (-51%), ICX (-77%), ADA (-70%), PPT (-80%), DGD (-79%), GAS (-84%), SNT (-59%), STRAT (-73%), NEO (-81%), ETC (-56%), QTUM (-74%), BTG (-72%), XMR (-39%), OMG (-67%).
Coins moved in a narrow band up or down of 1 to 2 points. SNT (-59%) and XMR (-39%) improved a level. GAS (-84%) remains the worst coin.
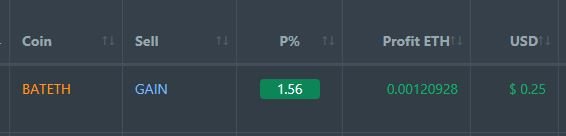
Profit Trailer Bot One closed trade on BAT (1.56% profit) bringing the position on the account to 4.10% profit (was 4.08%) (not accounting for open trades).
There remains one coin on the Dollar Cost Average (DCA) list with ETC improving 5 points.
Pending list remains at 7 coins with 4 coins improving, 2 coins trading flat and 1 worse.
PT Defender stepped up to defend 5 coins with OAX added to the list. This has been waiting for defence action from the big selloff some months ago.
New Trading Bot Trading out using Crypto Prophecy: No trades.
Currency Trades
Forex Robot did not close any trades and is trading at a negative equity level of 23.1% (higher than prior day's 20.1%).
Outsourced MAM account Actions to Wealth closed out 2 trades for 0.23% profits for the day.
Cautions: This is not financial advice. You need to consider your own financial position and take your own advice before you follow any of my ideas
Images: I own the rights to use and edit the Buy Sell image. News headlines come from Google Search. All other images are created using my various trading and charting platforms. They are all my own work
Tickers: I monitor my portfolios using Yahoo Finance. The ticker symbols used are Yahoo Finance tickers
Charts: http://mymark.mx/TradingView - this is a free charting package. I have a Pro subscription to get access to real time forex prices
October 22, 2018
Interesting to see volatility return to stocks and leave the cryptocurrencies. I guess traders continue to look where they can influence more and ride the trends. I like your put spreads but the implied volatility seem to be a premium which make more expensive than usual, right? Thanks for sharing as usual!
Implied volatility applies to both the bought and sold legs. There is more delta in the leg that is further out-the-money. So at trade set up that works in your favour. It does not work in your favour when you want to exit early before price reches the sold leg strike price.