TIB: Today I Bought (and Sold) - An Investors Journal #308 - Gold, Cloud Computing, Oil, US Retail, S&P500, Europe Supermarkets, US Index, Japan Govt Bonds
Market jitters continue on a tightrope between growth fears, tariffs, geopolitics and earnings. Trade action is about hedging and cherry picking bargains and rising yields

Portfolio News
Market Jitters
Markets are nervous but they like positive earnings stories
We will see quite a bit of flip flop in the markets as analysts swing between gloom and glee. I fully expect the rotation out of technology growth profits to continue and I will be exploring hedges in the coming days.
Cannabis Carnival
Canada runs out of pot on day one. Who could have guessed that would happen?
Stock prices in marijuana stocks took another dip. I will keep dipping in to add more especially as market size estimates grow.
Bought
Yamana Gold (AUY): Gold producer. I topped up my holdings in one portfolio as I had bought too few stocks first time around (decimals in the wrong place). See TIB307 for the rationale on choosing Yamana Gold as my preferred gold miner.
Red Hat (RHT): Cloud Computing. Averaged down entry price on a small holding in one portfolio. See TIB294 for the discussion on cloud computing and the rationale for adding Red Hat.
Sold
Petróleo Brasileiro ADR (PBR): Brazilian Oil Producer. Stock assigned on covered call expiry for 6.9% profit since October 2016. Sometimes this is the price of writing covered calls on stock one is holding. This is the first month of writing and the income was a tasty 4.46% of the purchase price. Stock price closed at $15.49 compared with the $11.39 close at the time of writing = 36% stock move in 4 weeks. I missed out on 29% stock growth on the stock that was assigned. I remain invested in Petrobras stock and through strike 12 call options = did not miss out totally.
Shorts
Japanese 10 Year Government Bonds (JGB). I have had a pending limit sell order waiting for Japan rates to slide lower looking for another move higher. That pending order was hit in overnight Friday trade as markets went risk off.
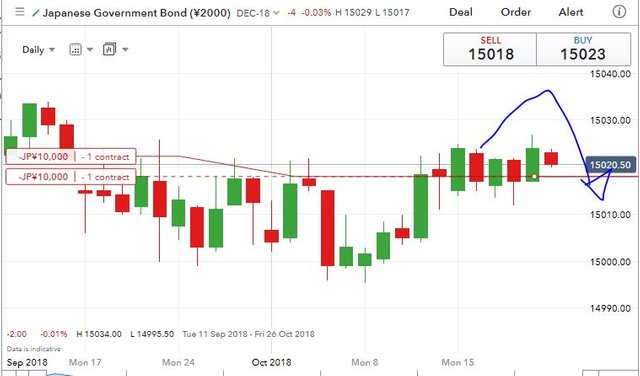
Note: this is a price chart. As rates rise, price falls. I am looking for price to fall.
Expiring Options
Rite Aid Corporation (RAD): US Pharma Retailing. 1.5 strike call options expired worthless with price closing at $1.01. This is what I wrote in August (see TIB278) about what I thought was a speculative trade looking for the market overreaction to work back to profit.
Maybe I will need a knight in shining armour to come along to pick up the pieces
I was not wrong - price continued to slide for a few days and did make a recovery almost back to the $1.50 level. Here is the updated chart.
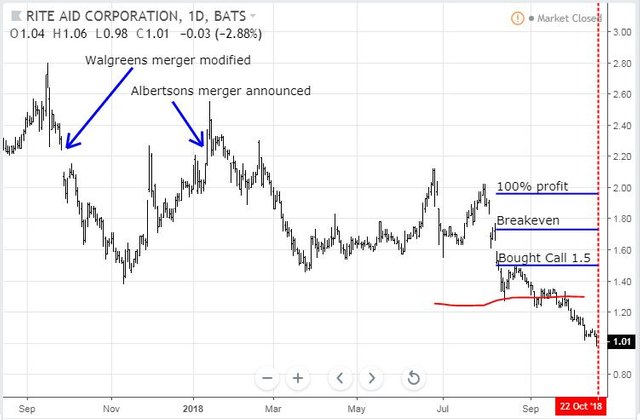
When it fell over again and dropped below the support level (red line), that was the time to close the trade and salvage some capital. One of the talking heads on CNBC's options show talked about using a 50% premium stop loss to protect capital. This conflicts with what my investing coach says - let them run to expiry was his view. With speculative trades like this the charts do give big clues about when to bale out. I will be looking to apply the 50% rule from now especially when options get to within one or two months to expiry.
SPDR S&P 500 ETF (SPY): US Index. Hedging trade 268/255 bear put spread short S&P500 expired worthless with closing price at $276.22. Since the trade was opened on June 28, price has stayed above the strike price even during the selloff last week. Hindsight suggests that the selloff week was the time to close out the trade. Hindsight and hedging trades do not work well together - the selloff could very easily have extended one more week. A quick update on the chart which shows price stay above the 268 level all the time.
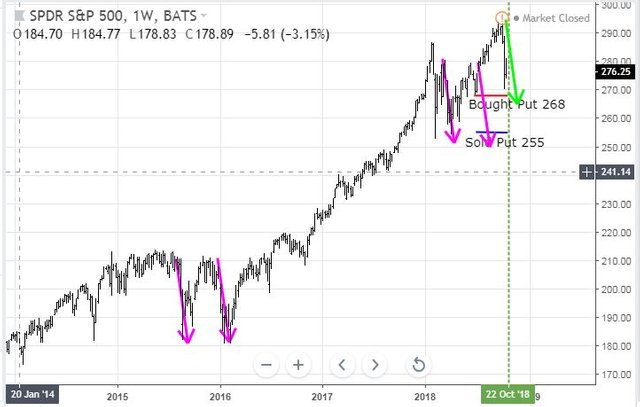
The key feature of the chart is the selloff the week before is about the same steepness and length as the prior selloffs (the green arrow is a clone of the pink arrows). This tells me that the trade idea was right - we were due for a correction and we did get one. The hard part of hedging trades is working out the timing
- When to start hedging?
- How far out in time to go if one is using options?
I did also add in TIB256 a chart of the cumulative Advance Decline Line (ADL) for the S&P500 which was suggesting that there was some risk that stocks could continue to advance. How does that look now?
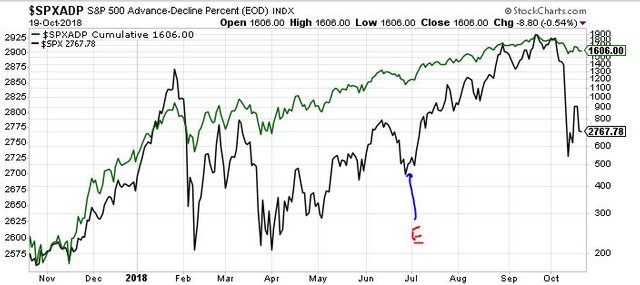
We can see that ADL (green line) continued to move ahead from trade entry time (marked E) right until the middle of September and then started to turn over. That tells me that, that is the time to think about the hedging trades = when ADL makes a 2nd lower low after the turnover.
Koninklijke Ahold Delhaize N.V. (AD.AS): Europe/US Supermarkets. 21 strike call options expired worthless with price closing at €20.05. This trade was set up as a short term trade also trading a potential price over-reaction to news. Again I present the updated chart (from TIB278) which shows the short term trade as the pink rays and the entry level as the red arrow.
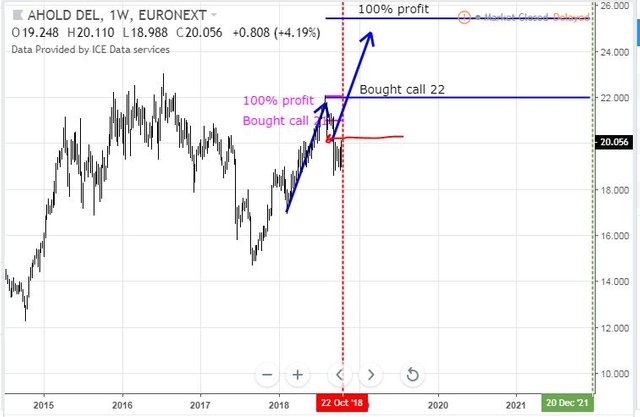
Price did go back to the 21 level for a few weeks and then dropped back over 10%. Maybe that was the time to salvage some capital. Price is back where it was when the trades were opened. The long term trade is going to need more than one blue arrow price scenario to make 100% profit but there are still over 3 years to go.
Income Trades
Only one covered call assigned during the month (PBR noted above). Income amounted to 1.26% on average which compares to my 1% target. The list was shorter than last month (12 vs 16) as a few stocks had slipped below the purchase price I had paid. My strategy is to write covered calls on stocks I am happy to exit if they get assigned.
Cryptocurency
Bitcoin (BTCUSD): Price range for the four days was $140 (2.2% of the high).
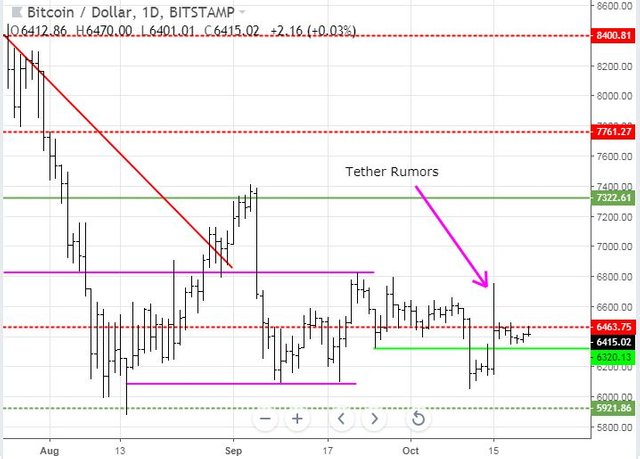
Price action on October 18 contains high and low for all the four days. Price is stubbornly refusing to break through the resistance level around $6465-6475 (lower dotted red line) and may well be respecting a new short term support level (the fluoro green line)
Ethereum (ETHUSD): Price range for the four days was $20 (9.7% of the high).
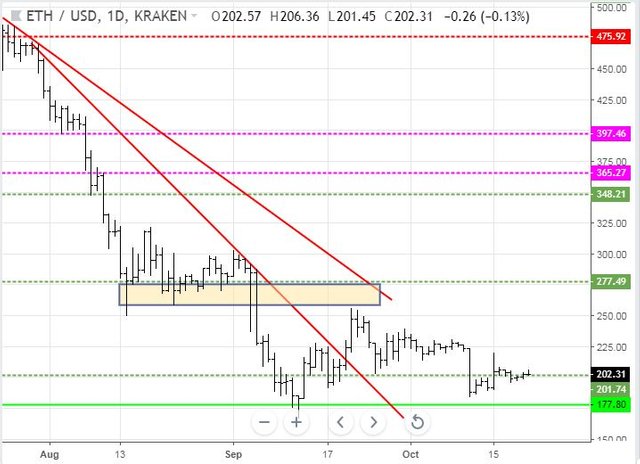
Price action looks a lot like Bitcoin with price oscillating around a horizontal level at $200.
CryptoBots
Outsourced Bot No closed trades. (221 closed trades). Problem children stayed at 18 coins. (>10% down) - ETH (-69%), ZEC (-64%), DASH (-68%), LTC (-51%), BTS (-50%), ICX (-77%), ADA (-70%), PPT (-80%), DGD (-78%), GAS (-83%), SNT (-60%), STRAT (-75%), NEO (-81%), ETC (-58%), QTUM (-75%), BTG (-72%), XMR (-40%), OMG (-68%).
More coins moved down than up with DASH the biggest faller. LTC (-51%), BTS (-50%), ADA (-70%), SNT (-60%), NEO (-81%), XMR (-40%) all dropped a level
DGD (-78%) improved a level and GAS (-83%) remains the worst in the 80% down club which now has 3 coins
Profit Trailer Bot 39 closed trades over 2 weeks (2.03% profit) bringing the position on the account to 4.08% profit (was 2.95%) (not accounting for open trades).
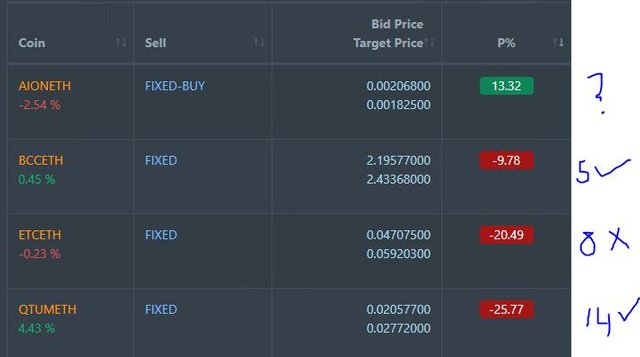
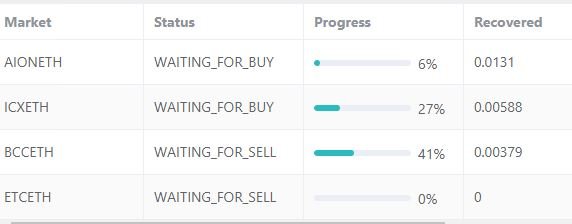
There remains one coin on the Dollar Cost Average (DCA) list with ETC looking like something of a dog.
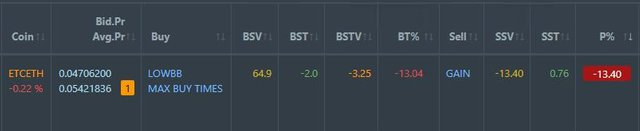
Pending list has had some changes as coins have moved in and out of PT Defender. List is now 7 coins with 6 coins improving and 1 worse. ETC is something of a problem child with a PT Defender trade sitting in DCA for quite some time now. Doubled up listing for AION is an anomaly - fixed now
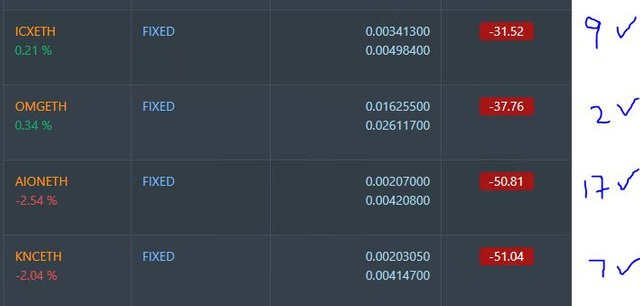
PT Defender has seen quite some activity since the last report. It has completed defence of BTG and CMT from the prior list and new defences on ZEC, OAX, ZRX and BAT. The current strategy is to deploy PT Defender when trades go 5% down.
New Trading Bot Trading out using Crypto Prophecy. No trades open.
Currency Trades
Forex Robot did not close any trades and is trading at a negative equity level of 20.1% (lower than prior day's 31.5%). I funded the account with additional funds to ensure the account operated with positive margin.
Outsourced MAM account Actions to Wealth closed out 9 trades for 0.10% profits for the period.
Cautions: This is not financial advice. You need to consider your own financial position and take your own advice before you follow any of my ideas
Images: I own the rights to use and edit the Buy Sell image. News headlines come from Google Search. All other images are created using my various trading and charting platforms. They are all my own work
Tickers: I monitor my portfolios using Yahoo Finance. The ticker symbols used are Yahoo Finance tickers
Charts: http://mymark.mx/TradingView - this is a free charting package. I have a Pro subscription to get access to real time forex prices
October 19, 2018
Hi carrinm sir...how are you... very interesting post sir...
I am well. I hope you are too. Thanks
Volatility gave a great opportunity to add some covered calls as well which helped for some income and protection. Market continues to seem resilient but timing is everything and that is part of the opportunity costs in investing into the markets.
Creeping switch back to US markets is helping hold returns together especially given the way Europe is lagging. Advance Decline Line is giving me guidance on hedging - probably QQQ first.