TIB: Today I Bought (and Sold) - An Investors Journal #304 - European Banks, Interst Rates, Australian Dollar
Delayed post. Markets wait for the Federal Reserve and China. Interest rates are not waiting whether in US or Japan or Europe. Big lessons on investing short the market - what not to do and how to recover from bad trades. First wave of covered calls written - more to follow. Crypto markets retreat to take a breather.

Portfolio News
Market Jitters - Tariff Tantrum US markets track sideways over two days
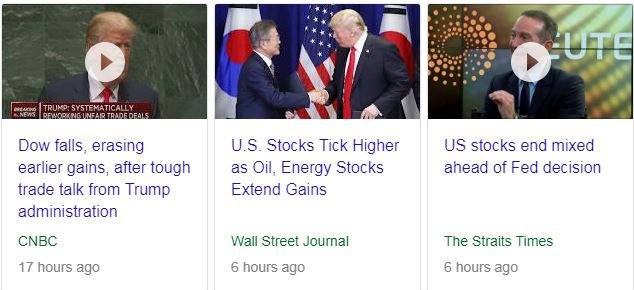
The headlines tell a story of two days of trade action. Erasing earlier gains on Monday and eking out gains on Tuesday. The third headline carries the clue of what is really going on - markets are waiting for the Federal Reserve decision. Market action has been remarkably robust since the extended tariffs were announced and came into effect on Monday. One of the talking heads reckons that China is taking time to respond because there is a lot of work to be done to understand the ramifications of $200 billion worth of tariffs. Maybe they have run out of wriggle room because they are already tariffing a high slice of imports from US. What appears to be key is that the tariffs at 10% are viewed as being marginal and a lot less scary than the 25%.
The yields news is the key news. 10 year Treasury Yields are now holding above 3% - no doubt about that.
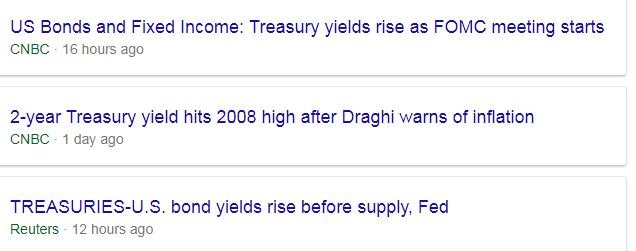
Europe Muddles Europe interest rate moves make more news
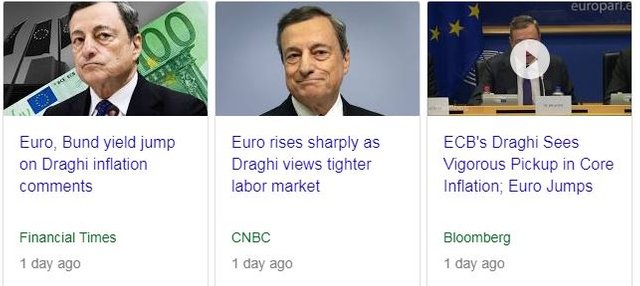
Mario Draghi, Governor of the European Central Bank (ECB) surprised markets. After making the normal droll and dull and uninspiring statement after the ECB meeting last week, he came to the European Parliament and said stuff with a completely different tone. Same data and a different message. Europe is doing better than ECB intimated last week and they are beginning to worry about inflation.
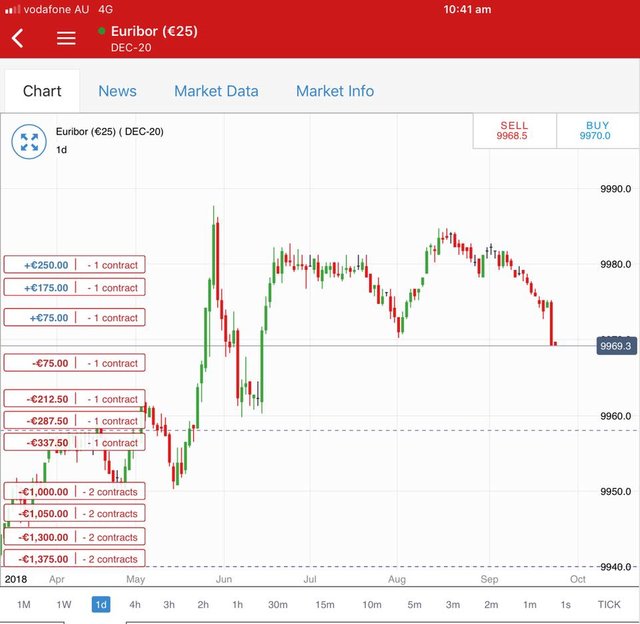
Rates moved and took out the prior lows - I am happy as I am positioned for exactly that - a few more positive numbers (3 now) on my staircase of futures contracts.
Note: This is a price chart. Price falls when rates rise.
This is why I have labelled this as Europe MUDDLES. They just love to obfuscate and muddle along and avoid making decisions. One just has to see the way they responded to the UK's latest Brexit proposals.
It is all very well to say a plan is not going to work. How about getting off your backside and make a counter proposal that you think will work? March 2019 will be on you in a hearbeat.
Shorts
iShares 7-10 Year Treasury Bond ETF (IEF): US Treasuries. Closed out half a short position for blended 4.6% profit since September 2013 and August 2016. The trade idea was for US interest rates to rise. This trade idea was right - interest rates did rise but not with the timing needed to make this a good trade.
The execution of the trade idea has big problems. Let's talk about it on the chart which shows price from 2011 and it shows a number of trades one of which was closed out today.
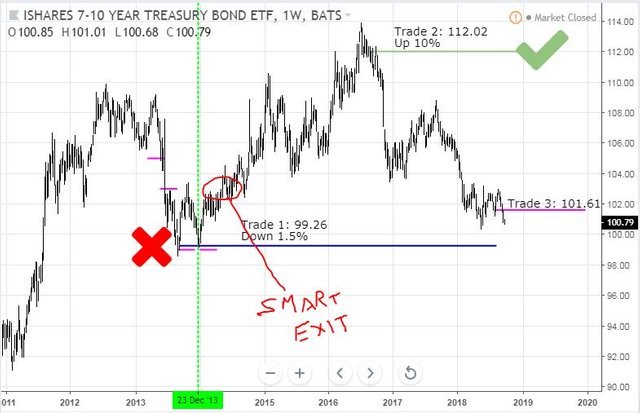
- Original trades were short term put options bought once the chart turned over and was starting to head down (i.e., rates were rising) shown as short pink rays. The first two trades together were hugely profitable. The next one at strike 99 expired worthless.
- I opened up a short position in September 2013 (marked X) with a view that rates would continue rising and go to the 2011 levels (the bottom of the chart)
- Price bounced back up and came back down to the entry level and I bought another 99 strike put option. It too expired worthless. At this stage I was in the short position already 3 months and paying carrying cost. When that last put option expired worthless was the right time to exit the short trade because price was very close to taking out the previous highs and was heading up. (Labeled Smart Exit - loss making but SMART)
- Now that I was in a bad trade, I looked for ways to average down the losses and bought another short position (in one account) after price peaked and started dropping again. (Trade 2). This run up is about the time that we were seeing short term rates rising faster than long term rates. Because this ETF is trading 7 to 10 year Treasuries it is somewhat influenced by the flattening yield curve (because of the 7 years in the portfolio). I have run the computations. If I close out the entire position in my core portfolio, Trade 2 will have generated enough profits to cover the carrying costs. So Trade 2 was a good recovery trade but high in risk and high in margin cost.
- In my other portfolio, I put on trade 3 to salvage some of the carrying cost - this might be a trade too late unless rates do move to 3.5% or even 4% (which can happen).
Lessons learned: Take into account carrying costs. Short positions need to be short in duration. Take the smart exit when the trade goes against you.
Income Trades
I started the process of setting up this month's covered call trades. I executed three trades in Europe all on European banks. Given what Mario Draghi presented to the European Parliament I will not be surprised to see all three of these stocks improve more than the 5% margin I have allowed.
A quick reminder on my process for writing covered calls.
- Select stocks I am happy to sell if I get assigned
- Calculate 5% move up in price from previous day close
- Choose a one month out call option closest to 5% move up in price.
- Place a bid between bid and ask. Ideally one should aim for a premium of about 1% to make this worthwhile - I do not check but I did average 0.76% last month (not accounting for two buybacks)
Here is the summary table.

The table shows purchase price and closing price, the premium received and the % relative to close and to purchase price. The strike is shown and the important columns after that are the amount price has to move to reach the strike price - you will see they are all around 5% with a few more than that. The net cost column is updated each month to show purchase price less accumulated premium received and adding back buyback costs - the percentage column at the end shows what contribution income has made compared to purchase price.
Cryptocurency
Bitcoin (BTCUSD): Price range for the two days was $397 (5.9% of the high). Price did exactly what I said
Do not be surprised to see price pause here and drop back to the $6500 mark before deciding to have a go at clearing $7,000
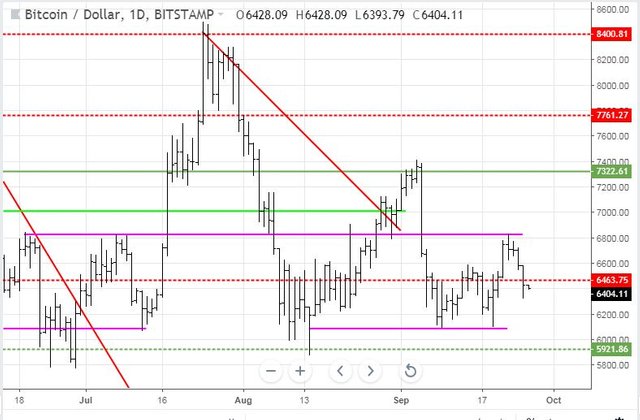
Now we will see if it wants to have a go. My concern is it closed below the support line and might well want to go down to test the pink ray.
Ethereum (ETHUSD): Price range for the two days was $43 (17.5% of the high). The congestion zone was too much headroom and price retreated to the support level around $200. Importantly it closed above.
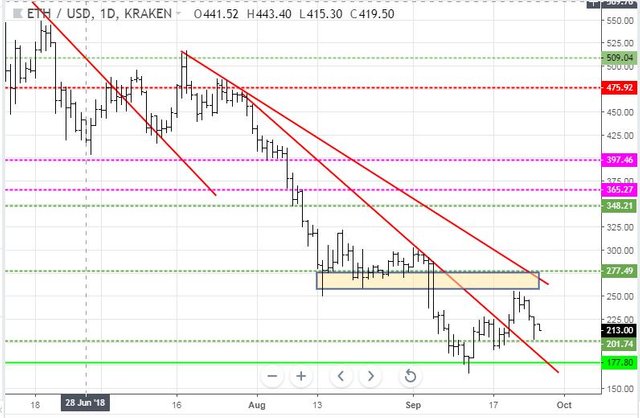
For a move up, we need to see price make a higher high. Yesterday's low is a higher low on this cycle - it needs to hold that to demonstrate any confidence.
CryptoBots
Outsourced Bot No closed trades. (221 closed trades). Problem children stayed at 18 coins. (>10% down) - ETH (-68%), ZEC (-60%), DASH (-61%), LTC (-47%), BTS (-45%), ICX (-79%), ADA (-69%), PPT (-82%), DGD (-83%), GAS (-84%), SNT (-57%), STRAT (-72%), NEO (-79%), ETC (-52%), QTUM (-78%), BTG (-72%), XMR (-33%), OMG (-67%).
A mixed two days with most coins down 1 to 4 points and one or two improvers. DASH (-61%) dropped a level and GAS (-84%) remains the worst.
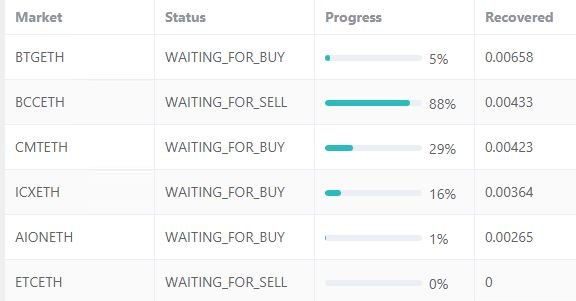
Profit Trailer Bot Five closed trades (1.41% profit) bringing the position on the account to 2.95% profit (was 2.80%) (not accounting for open trades). Profit Trailer only reports sales made by the bot - the ZIL PTD trade is included in the numbers but not on the Sales Log picture
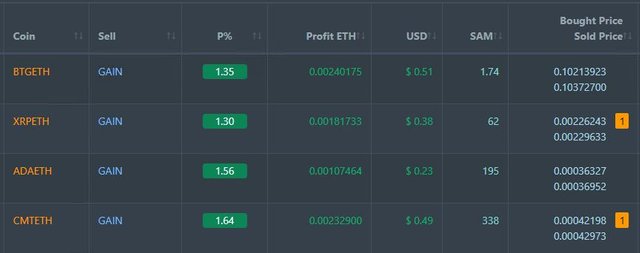
Dollar Cost Average (DCA) list drops to one with CMT moving off and onto profit after one level of DCA.
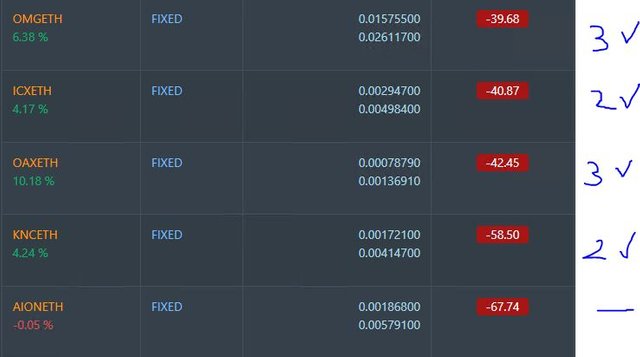
Pending list drops to 10 coins with ZIL completing PT Defender trades. 8 coins improving, 2 coins trading flat and none worse. Biggest improver CMT was at 9 points. It has had a roller coaster few days. As soon as PT Defender clears this it is off the whitelist.
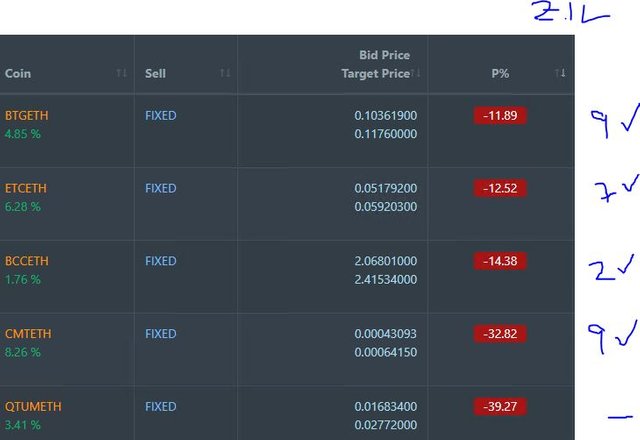
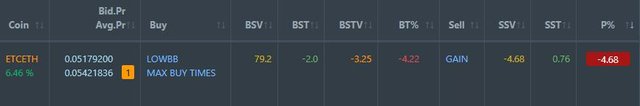
PT Defender: ZIL took out pending exit trigger for 1.20% profit. That leaves 6 trades being defended. CMT defence has completed one trade and sells are awaited on ETC and BCC. BCC should complete once this sale closes.
New Trading Bot Trading out using Crypto Prophecy. New trades set up on VET (1.54%) and XVG (1.87%) closed profitably.
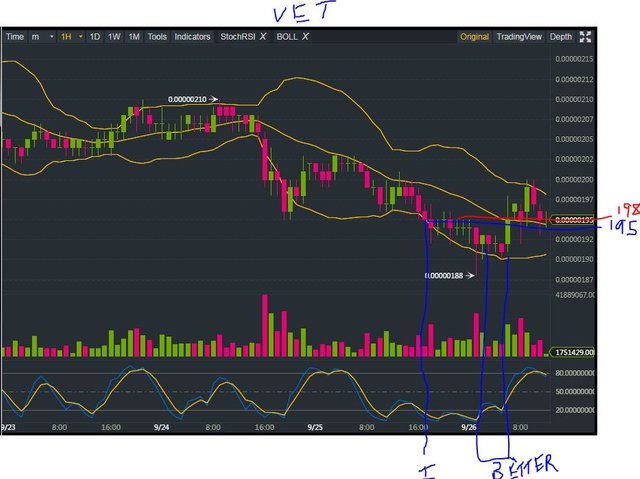
VET trade had a similar setup to XVG. I did not wait for the momentum indicator. I have shown two better places to enter the trade. As it happens I had exited already before the good trade set up arrived. This is where trading becomes challenging. The trade setup was not good but the trade was a winner = encourages bad trading.
There are some anomalies in the trading platform. I achieved prices on both trades that are higher than the charts showed (though they did get there at a later time slot). Maybe the time stamping of the trades is wrong.
Currency Trades
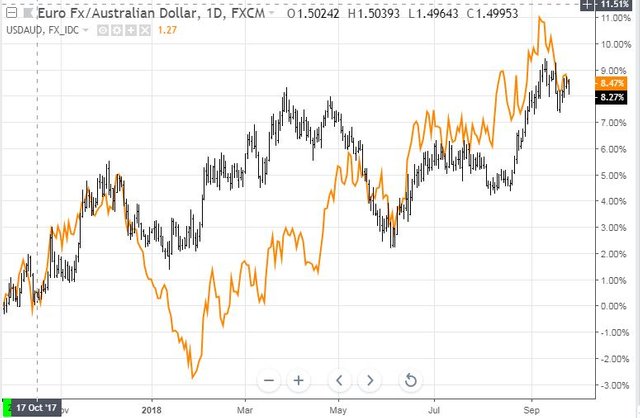
Australian Dollar (EURAUD): I needed cash to pay my Australian bills. I chose to sell Euros this time rather than US Dollars. Australian Dollar has been weakening against all major currencies and the last time I looked it was weakest against the Euro. The US Dollar has had something of a correction in recent weeks, especially against the Euro. My sense is that will reverse when the interest rate hike happens. The one year comparative chart shows there is not much (<1%) to choose between Euros (black bars) and US Dollars (orange line) on a 12 month view.
Forex Robot did not close any trades and is trading at a negative equity level of 19.1% (lower than prior 19.3%).
Outsourced MAM account Actions to Wealth closed out 7 trades for 0.72% profits for the two days.
Cautions: This is not financial advice. You need to consider your own financial position and take your own advice before you follow any of my ideas
Images: I own the rights to use and edit the Buy Sell image. News headlines come from Google Search. All other images are created using my various trading and charting platforms. They are all my own work
Tickers: I monitor my portfolios using Yahoo Finance. The ticker symbols used are Yahoo Finance tickers
Charts: http://mymark.mx/TradingView - this is a free charting package. I have a Pro subscription to get access to real time forex prices
Crypto Prophecy provides a useful tool to identify oversold and overbought coins - https://mymark.mx/CryptoProphecy
September 24-25, 2018
Housing in the US has also been seeing some headwinds and could potentially get worst if interest rates continue rising. While supply remains somewhat balances, the potential of Americans using their favorite savings accounts (home equity) has implications for the market in general.
I stepped out of housing a little while back. I have not spent too much time digging into the data on leverage. My understanding was that individuals had deleveraged extensively. This is a key leading indicator - time to dig out the tools