TIB: Today I Bought (and Sold) - An Investors Journal #303 - Insurance, Solar, German Banks, Steel, Oil Drilling, Oil, Aluminium, Japan
One US Market makes new highs. Doomsayers gather. A big two weeks drives half covered call trades to assignment. That might just be good news for my portfolios = cash in hand just when the doomsayers are saying things are a bit toppy. Cryptocurrencies find support.

Portfolio News
Market Jitters - Tariff Tantrum
Dow Jones closes at all time high in Friday trade

US and European markets continued to move ahead into the weekend. There was a little treading water especially in Tech Stocks with something of a rotation into more value stocks. This looks to me like window dressing ahead of the quarter end. For the most part, the talking heads language was all about things "going up," "risk on" and "all time highs". The headlines tell a different story. 3 headlines. Looming recession. Buy and hold. Markets plow back to record. That says it all - 3 ways markets can go and 3 headlines saying that it will. Without timeliness, only one headline is right. Pick your poison from the 3 links
The other headlines are about treasury yields and the impact on stocks
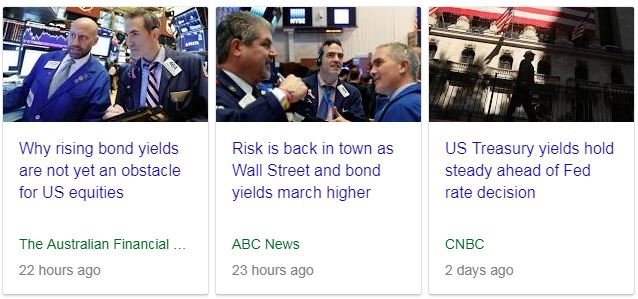
Same thing here - 3 ways markets can go and the headlines choose all 3. Yields on the ten year held above 3% and more importantly yields on the longer end also pushed higher. For quite some time the strategy advice has been to buy the short end. The doom mongers like to point to a yield over 3% as spelling the end of the road for equities. The question you have to ask is. "Is the yield a leading indicator or is it a coincident indicator?" The real question is can one rely on it as an indicator and how long do you have before you are right? My read is the yield is a result. It tells us that the economy is growing. It does not tell us that the economy has stopped growing. We only find out from the yield some time after that has happened.
Cannabis Carnival Marijuana stocks are running a volatile road.

Commentators are likening it to the cryptocurrency craze. I beg to differ simply because it has gone beyond the concept stage into the business building phase. I did lay out a strategy outline that I am following a few days ago in the comments to a post. Here it is again - material to guide your thinking (not advice).
I started with a basket of Australian listed stocks - I picked 3 and 2 went bust. Lesson 1. Pick a few. That was before there was an ETF. I like to use ETF’s to start but one is hostage to nervous investors bailing out and dragging the whole thing down. Idea 1. Start with an ETF (MJ -in US; HMMJ.TO in Canada). Idea 2. Take the components of the ETF and buy a mix of stocks below the top 3 because their prices have already moved hard. The problem I have with the ETF is it is a mix of stocks from US and Canada. The US stocks are vulnerable to the US legalization being derailed and a rush of fear. Idea 3: Pick a few Canadian stocks below the top 3. Prices will pull back - make an entry and top up on pullbacks. Idea 4. Cherry pick marijuana stocks in your own market but diversify by buying a few (e.g., StenoCare just done IPO in Denmark)
Big warning: stay away from pure grower stocks. They will be commoditized. Look for value added or integrated players. My holdings are in APH.TO and HVT.V and MMJ.AX, which is also listed in Frankfurt. It invests in a wide portfolio of businesses.
https://grizzle.com/stenocare-denmark-marijuana-ipo/
Income Trades
Covered call expiry date was Friday. The last two weeks of the month has seen strong stock price movements in Europe and in some US sectors. Of the 16 trades, 7 were assigned and 7 expired worthless. I did buy back two.
My strategy is to identify stocks that are currently in profit that I do not mind selling and then select a strike price that is 5% above the current price. If a stock moves 5% in a month, I am happy to exit is the idea. Assigned trades are listed under the Sold trades.
Société Générale SA (GLE.PA): French Bank. Bought back covered call for 169% loss. The buyback cost for the option was lower than assigning the stock and buying back the stock at the current price.
Bought
Aegon N.V (AGN.AS): Dutch insurer. Dividend reinvested as stock. What I like is no withholding tax through the dividend is taxable in Australia as income. There are also no brokerage costs.
Sold
Arcelor Mittal (MT.AS): Europe Steel. Stock assigned on covered call. 53% profit since October/November 2016. Income for covered calls amounted to 9.6%. Stock was bought on a view that European steel would close the gap on US steel makers as economies grew. See TIB19 for the first chart showing the gap.
Commerzbank AG (CBK.DE): German Bank. Stock price moved up nearly 18% since I wrote the covered call - WOW!! Maybe the time for European banking has finally arrived. Stock assigned on covered call. 31% profit since June 2016. Stock was bought on a view on European interest rates rising. I have been writing covered calls on Commerzbank since July 2016 and this is the 2nd time stock has been assigned. As I have accumulated 42% income since starting, I allocated a portion of that to buy back half the expiring options for a 518% loss. The buyback cost for the option was lower than assigning the stock and buying back the stock at the current price. As it happened the option close another 12 cents higher at the close. The buyback pays.The buyback did wipe out one third of the monthly income from covered calls.
I remain strongly exposed to Commerzbank through holdings across all my portfolios in stocks and call options.
Canadian Solar Inc (CSIQ): Solar Panels. Stock assigned on covered call. 11% profit since July 2017. Income for covered calls amounted to 2.4%. I wrote options on half my holding - I remain invested in solar via the other half holding and through Sunpower (SPWR).
Transocean Ltd (RIG): Offshore Oil Drilling. Stock assigned on covered call. 11% profit since May 2016. Income for covered calls amounted to 8.2%. I remain exposed through call options.
iShares MSCI Thailand Capped ETF (THD) Thailand Index. Stock assigned on covered call. 35% profit since June 2016. Income for covered calls amounted to 1.7%. I retain a small holding in this portfolio and am exposed in others.
Exxon Mobil Corporation (XOM): US Oil Producer. Stock assigned on covered call. 2% blended profit since July 2015 and February 2018. This covered call was covered by only a portion of my holdings. Income for covered calls amounted to 0.9%.
iShares MSCI Japan ETF (EWJ): Japan Index. Stock assigned on covered call. 52% profit since April 2011. Income for covered calls amounted to 0.45% (one trade only).
Expiring Options
Trades set up when steel and aluminium tariffs were announced expired worthless. Lesson from this is 7 months might not have been enough time for the effect of tariffs to work through. A step back to the charts tells me that the market never believed that the tariffs would make a difference, especially in the case of aluminium. Price basically collapsed directly the tariffs were announced (where the short blue ray begins).
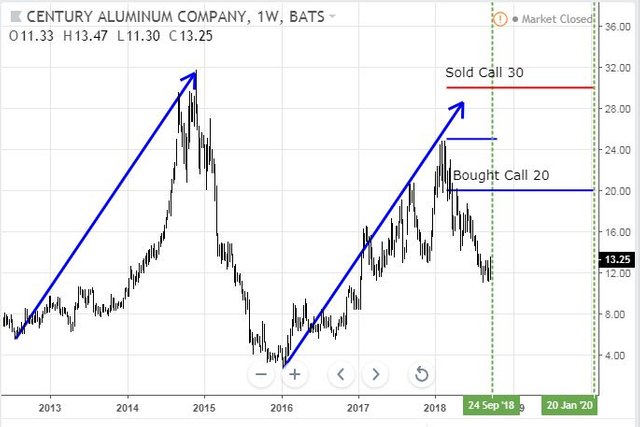
Century Aluminum Company (CENX): US Aluminium. Expired worthless. I remain exposed through longer dated calls which are hopelessly under water. There is one person sadder than me on the longer term trade = the person who bought the strike 30 call options I sold to create the bull call spread.
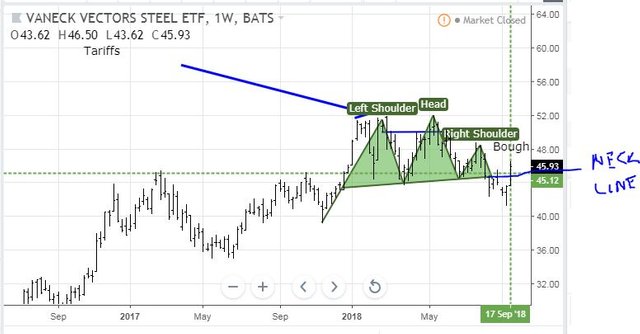
Van Eck Vectors Steel ETF (SLX): US Steel ETF. Expired worthless. I wrote this in TIB193
Was this a smart investment? Yes - in the 5 minutes I did the analysis before the market closed. No - because September 2018 may not be enough time AND the horse may already have left the stable.
My assessment was right - not enough time. I did take another angle on the trade in TIB282 - buy the stock to avoid being a hostage to time. The updated chart has some signs that I might just get out of head and shoulders jail with price breaking above the neckline in the last week.
KeyCorp (KEY): US Regional Bank. Expired worthless. I have rolled this out a few times looking for the interest rate kicker to push regional banks. Time ran out. In TIB281, I set out the rationale for the roll up. The updated chart shows that neither of the two price scenarios played out.
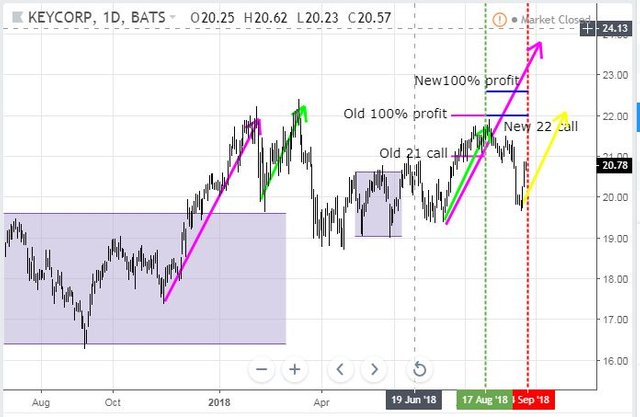
Price finished the green arrow scenario and did not go on to the pink arrow scenario and did not consolidate to start another green arrow run either. Instead it did a big retrace and went back to the level of previous green arrow run. Ouch! And to compound it I did not check the date of the next Federal Reserve meeting. I assumed it was before expiry - it is after. A proper check and I would have looked for another month. That may not have worked anyway as a repeat of the green arrow run (a yellow arrow) would only reach the 22 strike I was on. Lesson reinforced: avoid short term options trades. They are too prone to "hostage to time value"
Cryptocurency
Bitcoin (BTCUSD): Price range for the weekend was $343 (5.3% of the low). Price made higher high on two consecutive days and moved up to test the short term resistance line (the upper pink ray extended for this chart).
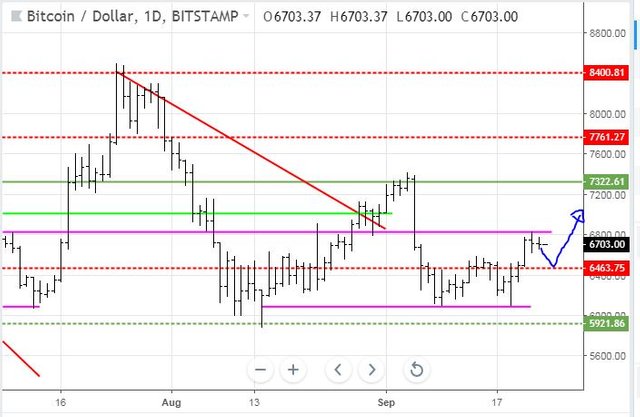
These short term lines are proving to be important. What it tells me is a lot of traders are using lower timeframe charts to do their trading - 4 hours and 1 hours - and not daily and weekly charts which is what most forex and stock traders use for support and resistance lines. Do not be surprised to see price pause here and drop back to the $6500 mark before deciding to have a go at clearing $7,000.
Ethereum (ETHUSD): Price range for the weekend was $35 (15.9% of the low). Price made a higher high on September 21 and then consolidated for the weekend with two quiet days. As expected price did stall at the congestion zone below $275 (the shaded rectangle added to the chart).
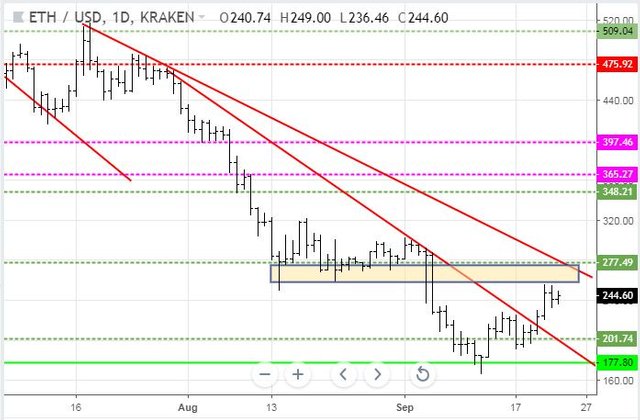
If price can make a higher high the next test will be the top of the zone at $275 and testing the underside of the downtrend line. The sellers are there.
CryptoBots
Outsourced Bot No closed trades. (221 closed trades). Problem children stayed at 18 coins. (>10% down) - ETH (-65%), ZEC (-63%), DASH (-59%), LTC (-45%), BTS (-41%), ICX (-77%), ADA (-66%), PPT (-82%), DGD (-82%), GAS (-84%), SNT (-57%), STRAT (-73%), NEO (-78%), ETC (-51%), QTUM (-76%), BTG (-72%), XMR (-32%), OMG (-66%).
Coins improved between 1 and 3 points apart from DASH which dropped. SNT (-57%) improved a level. GAS (-84%) remains the worst coin. There is a clear lag pattern compared to Bitcoin price. Altcoins drop harder than Bitcoin and then lag when Bitcoin recovers.
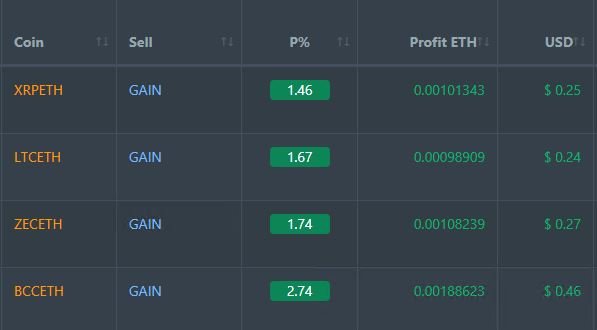
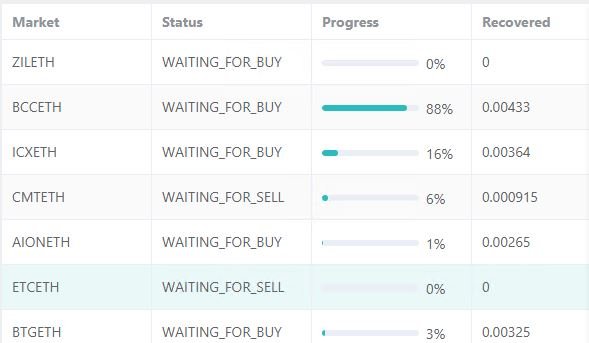
Profit Trailer Bot Four closed trades (1.90% profit) bringing the position on the account to 2.8% profit (was 2.71%) (not accounting for open trades). BCC was a PT Defender trade.
Dollar Cost Average (DCA) list remained at 2 coins with both faring badly over the weekend reaching 10% down each. My strategy is formulating firmly. No DCA. Start PT Defender at 5%. Stop loss at 7.5%. I will change the model to stop defending the Pending List trades and just ride them out separately from the robot.
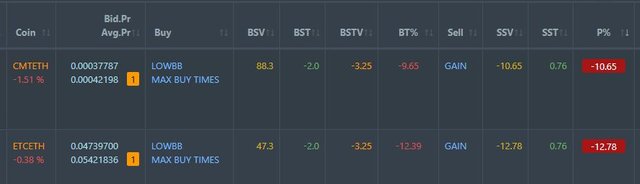
Pending list increased to 11 coins with ZIL added to the list for PT Defender defence. Overall there were 1 coin improving, 2 coins trading flat and 7 worse. Worst move was OAX.
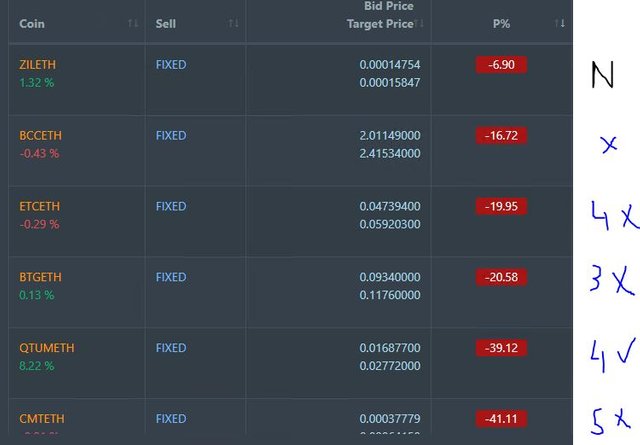
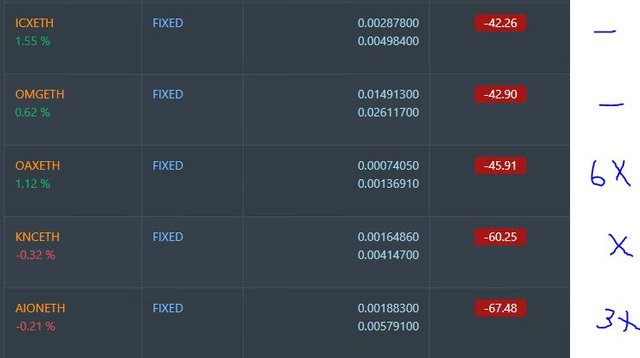
PT Defender is now defending 7 coins with ZIL added to the list. One trade made on BCC.
New Trading Bot Trading out using Crypto Prophecy. Open trade on TRX from September 5 closed (1.45% profit). New trade on BAT closed also for 1.45% profit - here is the set up chart.
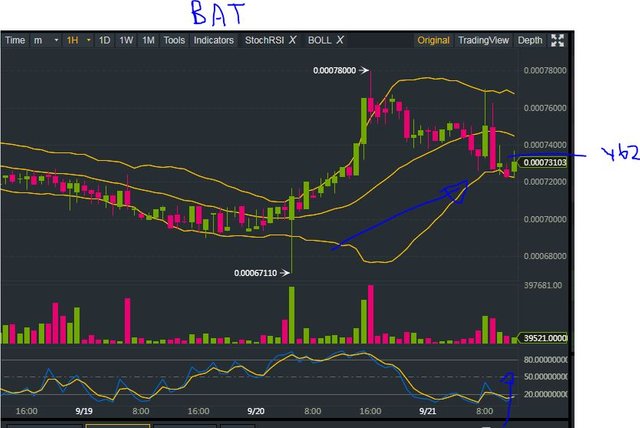
The updated chart shows what I am aiming to achieve.
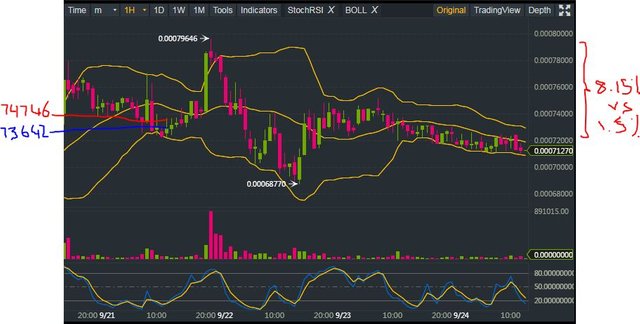
My trade opened and closed in one bar. The whole run from trade open to the high on the other side of the Bollinger Bands was 8.15%. A trading bot should be able to capture a large part of such a run.
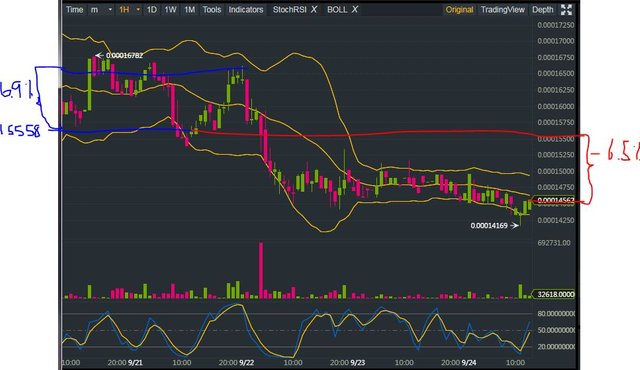
I did open one other trade on QSP. Well I left a pending buy order in place on Friday which was filled after I logged out. I did not put in a sell order and only looked at the charts this morning. The lesson is one of trading unattended - instead of a chance of winning anything up to 6.9%, my trade is currently 6.5% down. A bot would have won this trade. I will put in an exit above breakeven.
I have trades open on this one and DGD. DGD did make a run a little closer to my target price on a pump.
Currency Trades
Forex Robot did not close any trades and is trading at a negative equity level of 19.3% (higher than prior day's 17.8%).
Cautions: This is not financial advice. You need to consider your own financial position and take your own advice before you follow any of my ideas
Images: I own the rights to use and edit the Buy Sell image. News headlines come from Google Search. All other images are created using my various trading and charting platforms. They are all my own work
Tickers: I monitor my portfolios using Yahoo Finance. The ticker symbols used are Yahoo Finance tickers
Charts: http://mymark.mx/TradingView - this is a free charting package. I have a Pro subscription to get access to real time forex prices
Crypto Trading: get 6 months free trades with Bitmex for leveraged crypto trading. http://mymark.mx/Bitmex
Crypto Prophecy provides a useful tool to identify oversold and overbought coins - https://mymark.mx/CryptoProphecy
September 21, 2018
@carrinm just browsing on steemit and stumbled upon your page with your new post, reading through your material interesting analysis! I enjoy catching up with financial updates although I don't know much about option trading. Still great resources, upvote your post to support and for your hard work analyzing! :)
Thanks. I have written a lot. I do try to write for people who are still learning. Every now and then there is a lesson.
Nice great to know! Thx for writing for learners like myself lol~ I enjoy economic n financial info including stocks though options trading is one of those areas that is a bit more complicated to learn. Looking forward to your future posts!!! :D
Posted using Partiko iOS
It seems as if we are going to see a melt up in stocks as Q3 earnings look to be pretty good. However, that could drive wage growth somewhat higher which could bring inflationary pressure to margins for subsequent quarters. I also think that 2019 earnings will be challenging given the loss of tax reform advantage.