TIB: Today I Bought (and Sold) - An Investors Journal #226 - US Insurance, US Oil, US Oil Services, Dutch Postal Services, Bitcoin.
Markets shrug off geopolitics and soft US CPI data. Nightmare hits my Altcoin bot trades. More digging in the oil patch and strange trade activity in US Insurance

Portfolio News
Geopolitics The last few weeks have seen some key developments in geopolitics
- US withdraws from Iran Nuclear deal
- US delegation struggles in trade discussions in China
- North Korea says it will dismantle its Northern nuclear test site
- US opens new embassy in Jerusalem
- Trump orders Commerce department to help out Chinese firm ZTE
- Italy continues with stalemate government
- etc
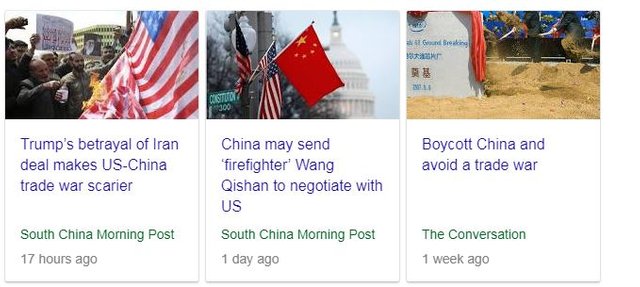
Markets have absorbed each of these with a degree of comfort. I am learning that markets do take geoplitics in their stride. What I find somewhat discomforting is the way Donald Trump walks all over deals. Why would he pull out of the Iran deal just when he is about to start a nuclear deal with North Korea? Maybe the South China Post is asking a smart question.
It is worth reading the article to measure the impressions on US National Security Advisor John Bolton - well, well, well!
Bought
Chesapeake Energy Corporation (CHK): US Oil Producer. I ran my normal stock screens across all markets. Chesapeake appeared on the price to earnings screen with a PE ratio under 10. My renewed interest in oil came from a Real Vision article which talked specifically about the Permian Basin. Chesapeake has key interests there. The price chart follows the pattern I like - beaten up since the 2014 oil price highs and showing signs of recovery.
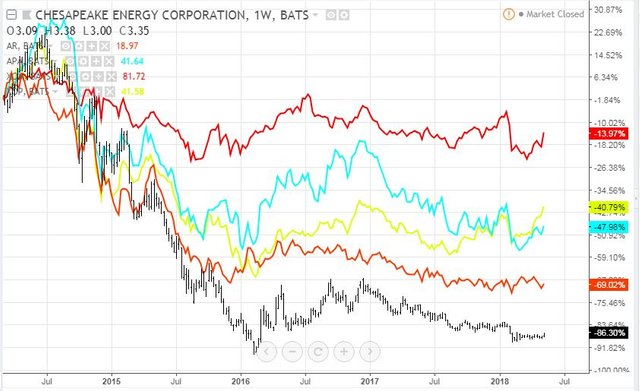
Chesapeake is at the bottom (black bars). Stacked above it are Antero Resources (AR - brown line), Oil Producers ETF (XOP - yellow line), Apache Resources (APA - blue line) and Exxon Mobile (XOM - red line). Close half the gap and and get to mid 2015 level will see price more than double, maybe even treble. Of course they do have to manage the long term debt burden.
The key to this investment is the oil price recovery. I do not make price predictions and I am skeptical of projections like the one Bank of America made about $100 oil. What I am seeing though is nobody is talking about oil below $65 a barrel for a while. That is good news as any oil price above the cost of production flows straight to the bottom line. I did check out the financials - I notice the leverage to rising oil prices in a recovering revenue line, solid management of overall expenses with gross margins improving and overheads under control.
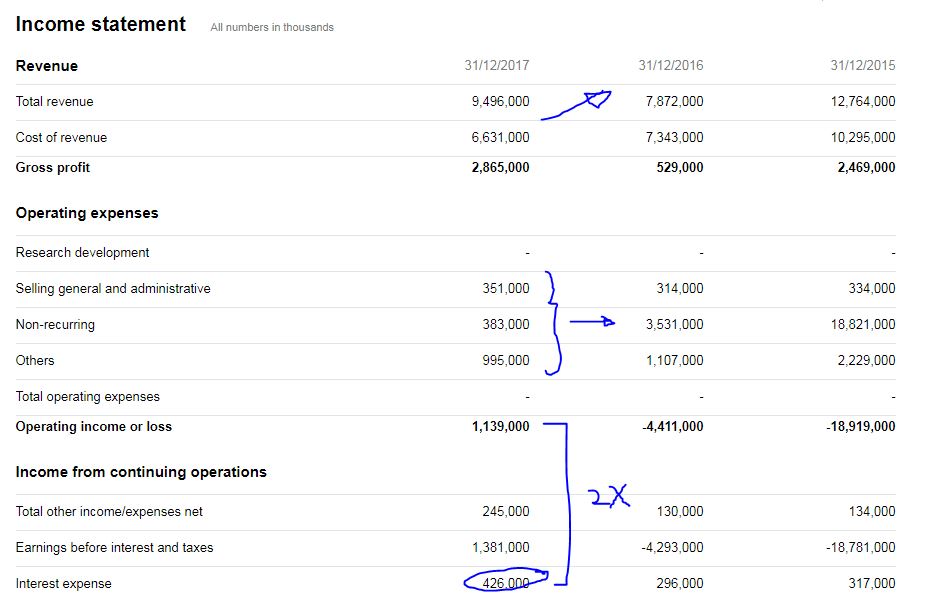
Interest cover is the key line - even with a big jump in interest expense (ringed) in 2017, interest cover is still better than twice.
https://au.finance.yahoo.com/quote/CHK/financials?p=CHK
Genworth Financial, Inc (GNW): US Insurance. I have been interested in US insurance for some time on the back of rising interest rates and a growing economy. This generally means that underwriting income and investment income rise together making for improving overall profits. I have had a bid out for some time on a bull call spread on Genworth, the most beleaguered of the insurers. Bought January 2020 3/5 bull call spread for net premium of $0.68 which will make 194% profit if price passes $5 on or before expiry.
How does that look on the charts which which shows the bought call (3) as a blue ray and the sold call (5) as a red ray with the expiry date the dotted green line on the right margin.
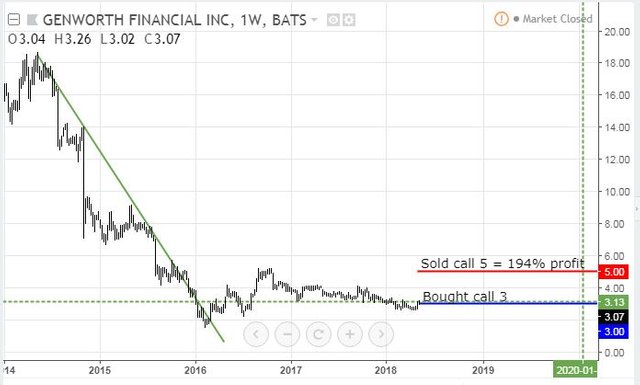
Price tried to break the downtrend in early 2016 when the business was subject to a takeover from a Chinese insurer, China Oceanwide Holdings Group. That takeover offer is still on the table and has been extended a few times to give time to resolve regulatory issues. Australian regulators have given their approval which is a positive step. Complicating the merger timing is there is a tranche of debt maturing on May 22, 2018, which has to be dealt with
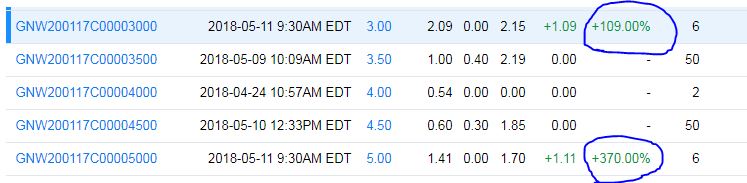
I did get hit on my bids in one of those market open price anomalies - my spread bid was hit but the prices for the individual legs were way off the market. My trade is small and the person who bought the sold leg may be particularly aggrieved if this deal ends up worthless.
Dawson Geophysical (DWSN): US Oil Services. Received 5 for 100 stock bonus dividend.
Post NL (PNL.AS): Dutch Postal Service. Received 43 for 800 stock in lieu of dividend. Reduced breakeven on trade for 4.22 to 4.06.
Cryptocurency
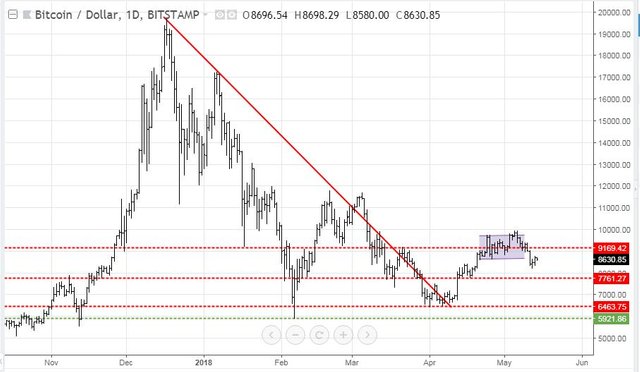
Bitcoin (BTCUSD): Price range for the weekend was $810 (9.0% of the high). Price was holding inside the price channel it has been in for a few days and then collapsed on news of an exchange raid in South Korea. The chart is uncomfortable as price is sitting in "no mans land" between two support lines on the daily chart (dotted red lines come from daily, green from weekly).
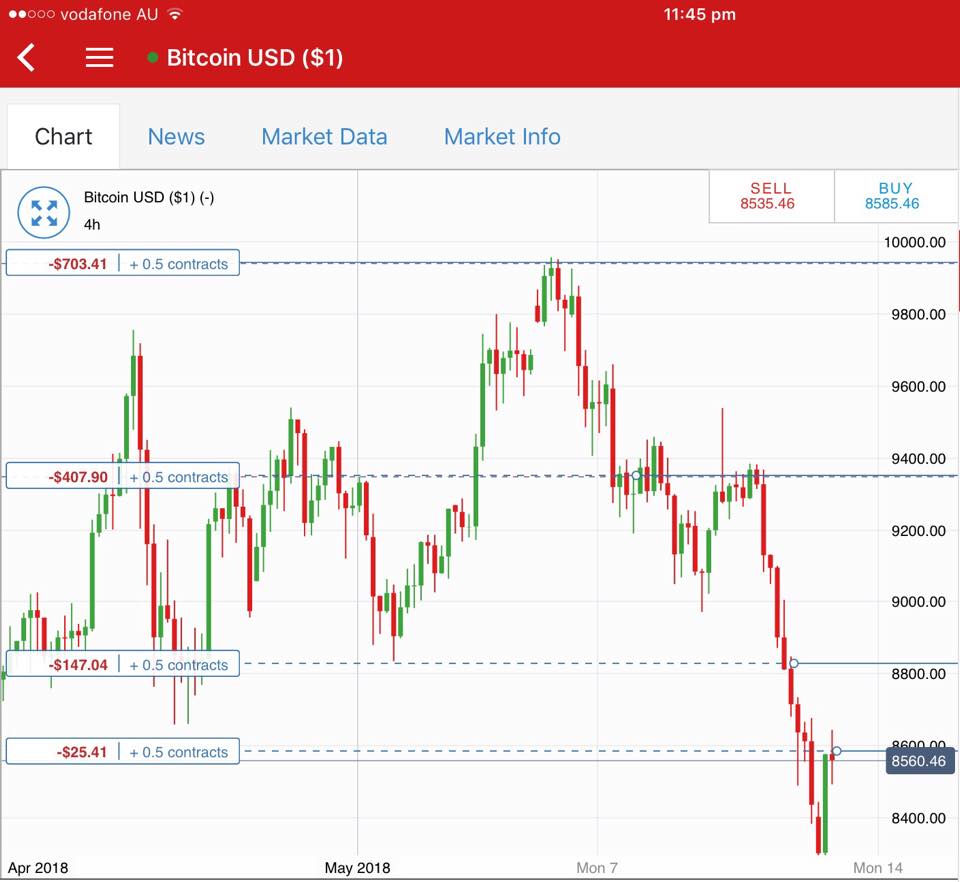
I traded the price dip twice with Friday's trade turning into a "catch the falling knife" trade. The other trade was based on a solid reversal on a 4 hour chart which did not hold but was followed by another reversal which appears to be holding.
CryptoBots
Outsourced Bot One closed trade on this account - ARK (1.42%) (198 closed trades). Problem children was reduced by three with TRX, ENG, ARK all falling below the 10% threshold (>10% down) - (13 coins) - ETH, ZEC (-44%), DASH, ADA, PPT, DGD, GAS, STRAT, NEO, ETC, QTUM, BTG, XMR. There remain a few trades that are worse than 40% down with ZEC the worst still
Profit Trailer Bot I hit some big API troubles with this bot on Friday. I had turned the bot off when Ethereum and Bitcoin price was collapsing. I opened up the gates for trading. I was checking my Binance account to check out volume movement on BQX. It looked like it was setting up for a pump and dump. I saw that there were multiple duplicated trades on a few coins though the robot was not reporting any trades. I checked the error messages and see that there was an API problem - this must have occurred just as the buy orders went in on the API. Bot opened 29 trades on XRP, 6 on VEN, 15 on BQX and 7 on NEO. 29 trades on XRP was 1342 XRP - ouch.
Yikes!! I was able to close out all the trades manually and fixed the API problem by restarting the robot. It is disturbing to see stuff like that happen especially when one is trying to build an unattened capability. Profits were BQX (2.41%), NEO (0.73%), VEN (0.51%), XRP (1.16%) and given the scale of the trades this turned the cumulative profit percentage of this account from a loss of -0.52% to a positive 0.11%. Talk about a lucky break.
In normal trade, the bot closed 12 trades over the weekend mostly trading in and out of NEO and NULS for an average profit of 1.51% and a positive 0.29% on the account (222 trades reporting in Sales Log).
Dollar Cost Average (DCA) list remains at 10 with ICX going off the list and making its way back with a few profitable trades.
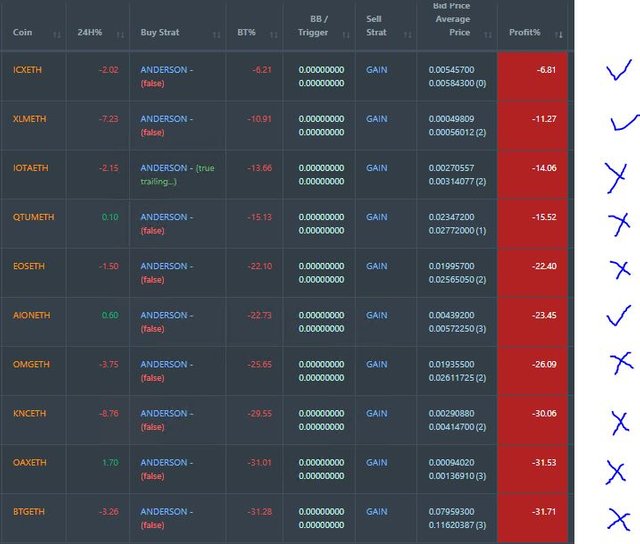
Of the 10 on the list, 3 did better and 7 worse but there are now 3 coins trading at worse than 30% down. I am now not running any DCA purchases - the plan is to progressively shut down this list and switch to a stop loss strategy and to use a whiteliest approach - i.e., choose which coins to trade rather than choose based on coin trading volume.
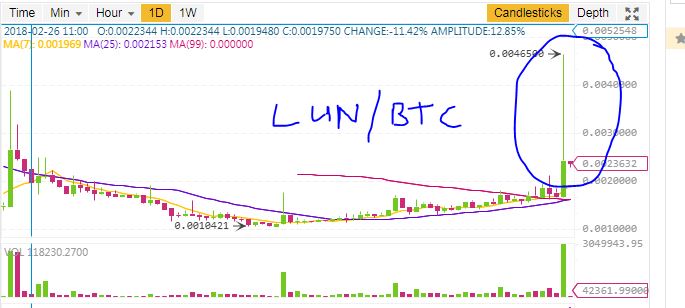
Separately, a pending order on LUN/BTC which was a left over from the DCA list when I changed from BTC pairs to ETH pairs was closed for a small profit as it went through a pump and dump. The chart shows the spike in price.
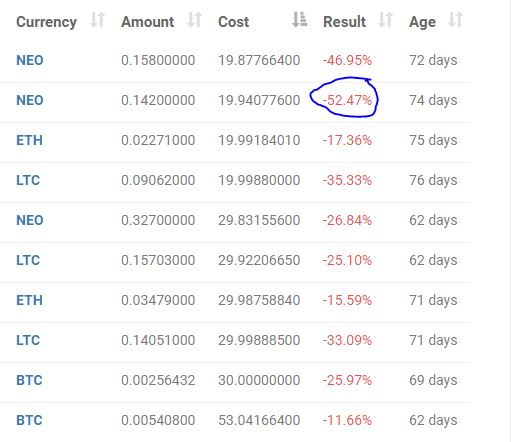
New Trading Bot Positions slid to -26.2% (was -25.3%) through they were well below 30% down over the weekend.
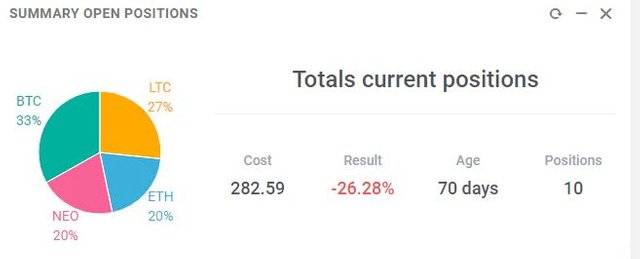
The overall list has a few ups (LTC, ETH) and a few downs (NEO, BTC) - NEO remain the problem at over 50% down.
Currency Trades
Forex Robot closed 14 trades (1.14% profit) and is trading at a negative equity level of 20% (lower than prior day's 20.5%).
Cautions: This is not financial advice. You need to consider your own financial position and take your own advice before you follow any of my ideas
Images: I own the rights to use and edit the Buy Sell image. News headlines come from Google Search and SCMP.com. CHK financials come from Yahoo Finance. All other images are created using my various trading and charting platforms. They are all my own work
Tickers: I monitor my portfolios using Yahoo Finance. The ticker symbols used are Yahoo Finance tickers
Charts: http://mymark.mx/TradingView - this is a free charting package. I have a Pro subscription to get access to real time forex prices
Bitcoin: Get started with mining Bitcoin for as little as $25 http://mymark.mx/Galaxy
May 11, 2018
Upvoted ($0.20) and resteemed by @investorsclub
Join the Investors Club if you are interested in investing.
a very useful program,i support the program,it is a very useful work my friend,@carrinm
This good news...thank you @carrinm
yet another insightful view of the market - I will keep plugging away at my investments as a result.
after reading your post, the I really like your idea, this is useful information for the future, and I will continue to follow your post .. because this moment useful for me and other steemit user @carrinm