TIB: Today I Bought (and Sold) - An Investors Journal #218 - UK Utility, US Insurance, Japan Govt Bonds, Social Media, Europe, Bitcoin
Attention turns to the Federal Reserve. The US Dollar is making its choice. Profit taking continues in Europe and UK. Bitcoin rejects the lows again.

Portfolio News
US Dollar The US Dollar has been quietly strenghtening after a rocky period and hit a 4 month high during day's trade. At the same time 10 year Treasury yields have continued to test the mythical 3% level. The strength suggests to me that the Chinese selling of Treasuries has eased off and whatever selling that is happening now is predominantly from US holders.

The dollar’s consensus-defying climb has the currency approaching pivotal levels at the start of a week that could make or break its rally

This move in the US Dollar suggest to me we are reaching crunch time on US interest rates. Europe can only follow.
Bought
Centrica plc (CNA.L): UK-based Utility. I ran a Price to Sales screen on UK market to find candidates to replace J. Sainsbury. I liked the shape of the Centrica chart - price tried to break the downtrend in 2016 and traded in a range for a while before falling again to a new trading range. Price has now broken out and will make a 50% return if it gets halfway to the top of the 2016/17 range.
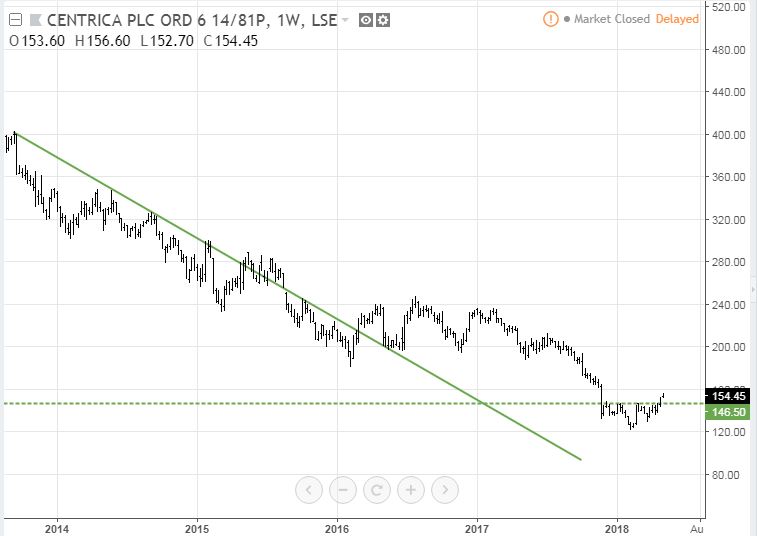
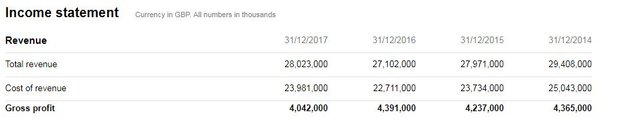
The challenge for Centrica is how to generate growth in their business. Revenues and operating profit have been flat-lining over the last 4 years. Dividend yield is a tasty 7.97% and ex dividend date is May 10 so the stock will rank for dividend in a week.
SPDR® S&P Insurance ETF (KIE): US Insurance. Financial stocks have been taken down during earnings season even though results have been solid. Averaged down my entry point by doubling my position - see TIB202 and 205 for the rationale on US Insurance
Snap Inc (SNAP): Social Media. Snap announced results after market close which disappointed the market. Perception is that users and advertisers do not like the re-architected design. With 191 million users and a compelling revenue per user I find it hard to believe that the 15% drop in price was warranted.
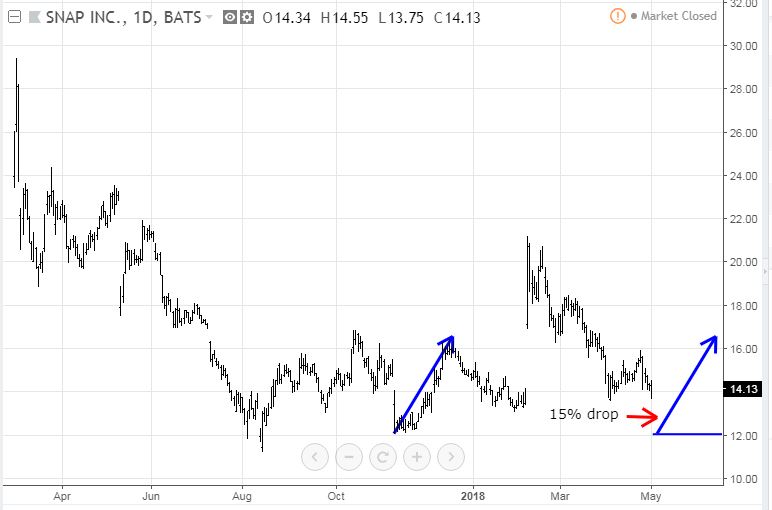
My trade level is the blue ray which is as low as the last lows. We have seen this before. Repeat the recovery like the one in late 2017 and the trade will be a 33% winner (the blue arrows)
Sold
WisdomTree Europe Hedged Equity Fund (HEDJ): Europe Index. This holding was added to the portfolio on the premise that Europe under-performance relative to US would close. The challenge of investing across markets is one introduces currency risk. This ETF attempts to neutralise the fluctuation between the US Dollar and the Euro. At the time I bought this ETF, the Euro was weakening against the US Dollar which means that some of the stock gains would be given away in currency losses. Hence the hedged trade was put in place. What shows up on the charts?
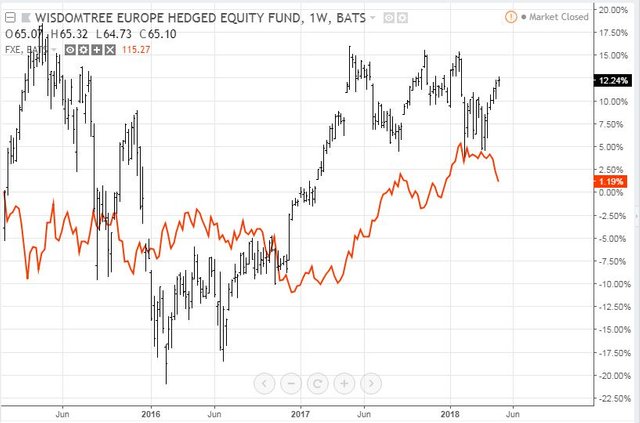
The early part of the chart of the ETF (black bars) against a Euro currency ETF (FXE - orange line) shows the hedge working with the stock rising while the Euro fell. The strange part of the chart is the stock also rose when the Euro was rising in the middle of the chart - this will be because solid stock performance was being improved by stronger Euro translation which was greater than the cost of the hedge. Digging deeper into this ETF shows that 50% of the stocks earn revenues outside Europe - so it is not truly a Europe ETF. I took profits as I felt I no longer needed the hedge for 7.8% profit since January 2015. Maybe I was impatient.
AMA Group Limited (AMA.AX): Australian Auto Services. Trade hit its stop loss for 16.8% loss in 9 days. Research house got that one wrong.
Amsterdam Index (AEX): Sold December 2020 strike 450 call options for profits of 99.5% since January 2016. I remain exposed to 500 strike call options with December 2019 and December 2021 expiries. Current level is 555.
Time to explore 600 strike calls if one believes that market growth will continue with earnings growth.
The British Land Company Plc (BLND.L): UK Property. Brexit is having a major impact on UK property market. Time to take profits for 9.3% profit since March 2017.
Shorts
Eurodollar Interest Rate Futures (GEZ20): Sold half of June 2020 strike 98.5 put options for 173% profit since July/August 2016. Debate is on as to whether the Federal Reserve will make two or three more rate hikes in 2018. I took profits on half my holdings to reduce the uncertainty in the trade which has exhausted its asymmetry. Part of the proceeds went on the Insurance ETF which still has asymmetry in it and will benefit from rising rates.
While I was travelling a number of Eurodollar December 2019 futures hit their profit targets below the current price range.
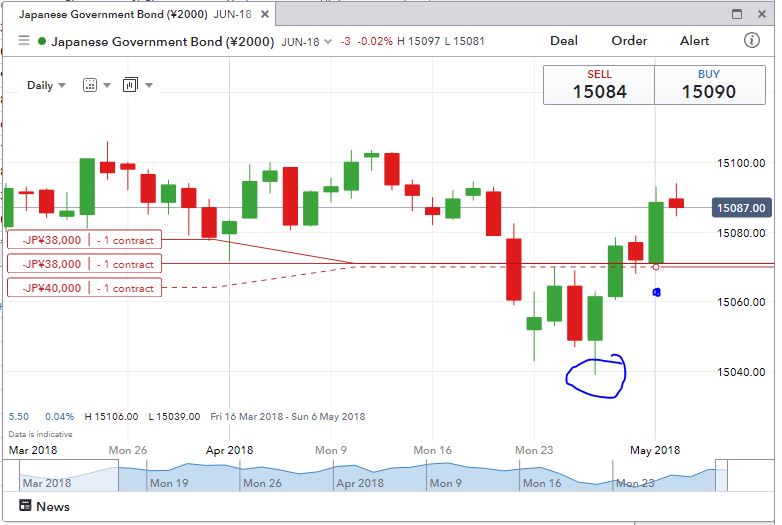
Japanese 10 Year Government Bonds (JGB): While I was away one of my JGB futures hit a profit target well below the price range at 15040. I replaced the trade a few days later on a 4 hour pullback (the right hand dot marks the trade). I remain exposed to 3 contracts.
Income Trades
I set up Income Trades on US markets before market open and made adjustments on market open. Only one bid was taken up to add one in Europe done on Friday.
BNP Paribas SA (BNP.PA): French Bank. Sold May 2018 strike 66 calls for 0.78% premium (0.31% to purchase price). Closing price €63.57 (new trade). Price needs to move another 3.8% to reach the sold strike (new trade). Should price pass the sold strike I book a 3.6% capital gain.
Wells Fargo & Company (WFC): US Bank. Sold May 2018 strike 55 calls for 0.53% premium (0.79% to purchase price). Closing price $52.08 (lower than last month). Price needs to move another 5.6% to reach the sold strike (easier than last month). Should price pass the sold strike I book a 193% capital gain. Income to date amounts to 8.3% of purchase cost.
Cryptocurency
Bitcoin (BTCUSD): Price range for the day was $434 (4.7% of the high) which is well below average volatility.

Encouraging part of the chart is that price has pulled into a consolidation range and rejected the bottom of the range with a low test bar [Means: Price opened and went lower and closed about the same level as the open leaving a long tail on the bar]
In my Bitmex account, I went back to spreads by buying a June future at $8992 on the basis of the low test bar shaping as a reversal on a 4 hour chart and shorting a September future at $9037. Last time I did this I made a handsome profit on the short and waited my time to make a profit on the long
CryptoBots
Outsourced Bot 2 trades closed on the account on XLM (1.93%) and ARK (1.35%) - (186 trades closed). Problem children (>10% down) list was unchanged - ETH, ZEC, DASH, ENG, GAS, STRAT, NEO, ETC, BTG (9 coins)
Profit Trailer Bot Overall the bot closed 4 trades for an average profit of 1.40% bringing overall loss to -0.81% of total balance. I changed the bot yesterday to run at two levels of dollar cost averaging and to remove stop losses. Of note is that EOS recovered from 3 levels of DCA - the upside of DCA when it works
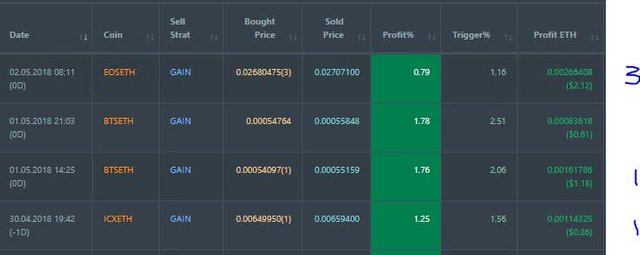
Dollar Cost Average (DCA) list was reduced by two with ICX and EOS making it to profit. Of the 6 left on the list 3 did worse and 3 did better. GTO did trade into profits above the exit trigger but did not exit.
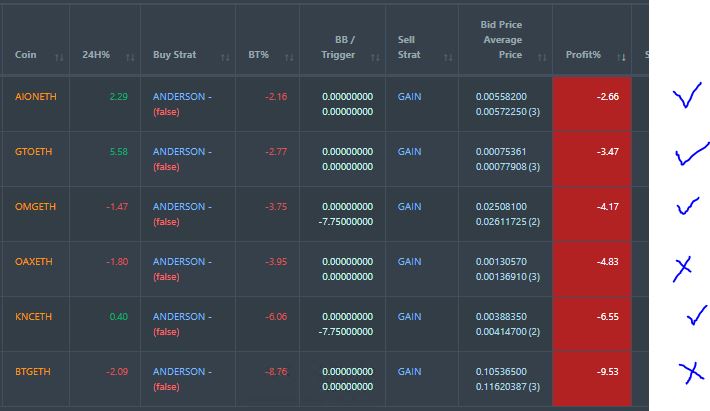
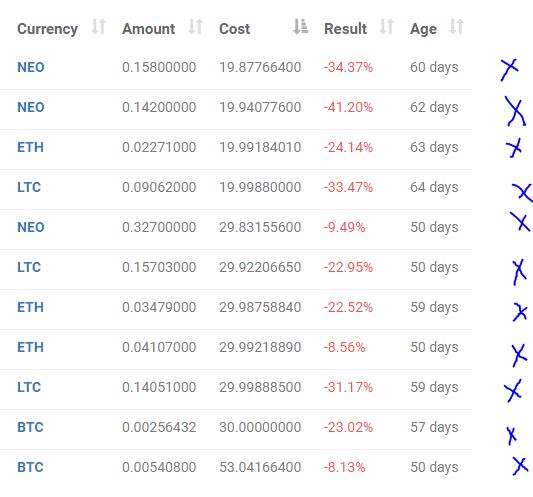
New Trading Bot Overall trade positions are down 21% (was 19%).
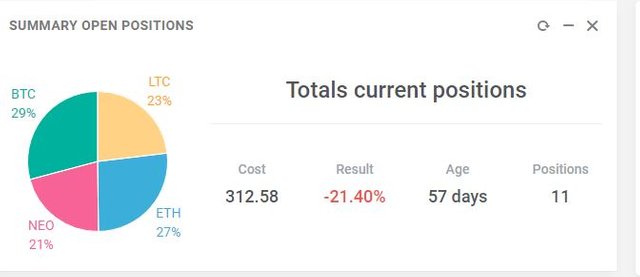
All positions traded worse with NEO the worst performer on the day.
Currency Trades
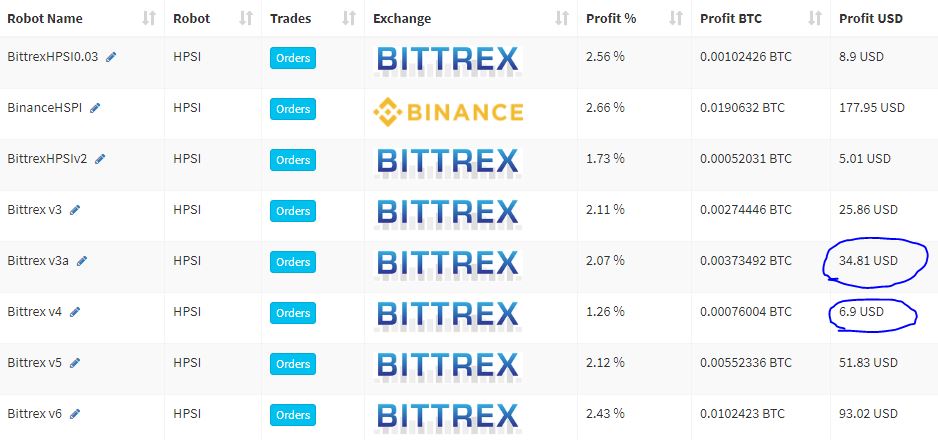
Forex Robot closed 4 trades (0.16% profit) and is trading at a negative equity level of 21.2% (higher than prior day's 16.1%). Currency markets are going through a major change with burgeoning dollar strength. This is a time when trading robots become problematic - they take time to adjust to the changing dynamics if they ever do. I will not be surprised to see this robot taking some loss trades to get back into equilibrium.
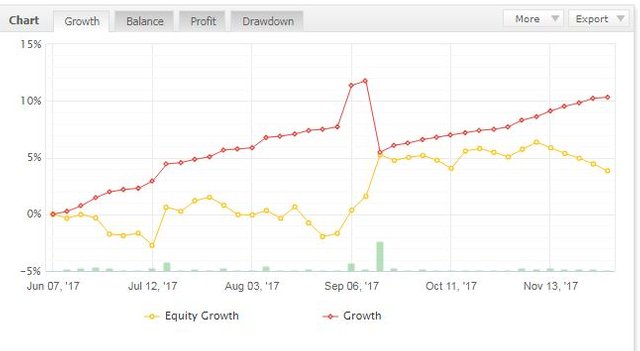
The equity curve shows that the account is still in positive equity even with the large current negative equity position. The chart also shows the dip in the red line the only time the robot has taken loss making action.
Outsourced MAM account Actions to Wealth closed out 1 trade for 0.13% profits for the day.
Cautions: This is not financial advice. You need to consider your own financial position and take your own advice before you follow any of my ideas
Images: I own the rights to use and edit the Buy Sell image. News headlines come from Google Search. Centrica financial data comes from Yahoo Finance. All other images are created using my various trading and charting platforms. They are all my own work
Tickers: I monitor my portfolios using Yahoo Finance. The ticker symbols used are Yahoo Finance tickers
Charts: http://mymark.mx/TradingView - this is a free charting package. I have a Pro subscription to get access to real time forex prices
Crypto Trading: get 6 months free trades with Bitmex for leveraged crypto trading. http://mymark.mx/Bitmex
Bitcoin: Get started with mining Bitcoin for as little as $25 http://mymark.mx/Galaxy
April 30/May 1, 2018
Reply to my last blog post everytime you make a blog post and I will upvote and resteem it for free to my 36,000+ followers. @a-0-0