TIB: Today I Bought (and Sold) - An Investors Journal #216 - French Energy, German Banks, Airlines, Europe Financials, Renmimbi
Markets were happy until late afternoon. FBI raids? Monday sales order flow? Maybe a new CEO can fix Deutsche bank. Added to European financials and utilities. And another go at European interest rates. This is like an addiction.
Portfolio News
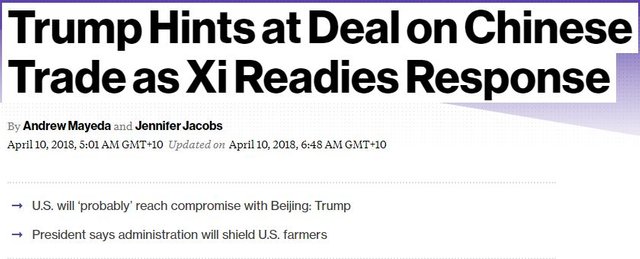
Tariff Tantrum The tariff tantrum took a different turn when news came out that China would consider using devaluation of the Yuan as a tool in the trade war. It is a game that China has played successfully in the past.

Now it is clear that negotiations are going on hard behind the facade of words and there could well be a deal agreed - when is a good question? Markets had discounted the fear for a while and then got slapped back in the last hour of trading.
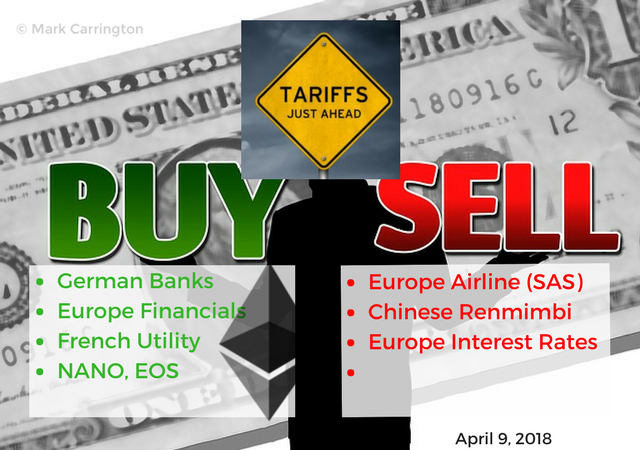
Bought
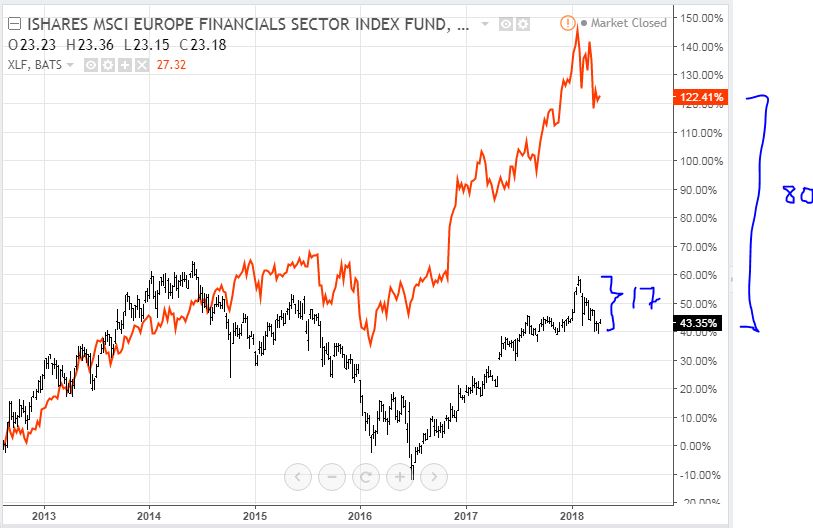
iShares MSCI Europe Financials ETF (EUFN): Europe Financials. One of the US-based talking heads suggested that European Financials were a great buy after the selloff from last week. I am heavily exposed to European Financials in my portfolios - I added one more in this US-listed ETF. The attraction is the selloff knocked 17% off the price and there is an 80 percent gap to US Financials. Close half that gap and there is a 40% gain right there.
I will reduce some of the US Financials exposure to fund this purchase.
Deutsche Bank AG (DBK.DE): German Bank. Deutsche Bank took action to replace CEO, John Cryan, who has not delivered the promise in his 3 year tenure. New CEO - Christian Sewing, with immediate effect, was drawn from the retail bank and is a long time member of the bank and also German speaking and with a track record of cutting costs. Added a small parcel of December 2021 strike 16.07 call options to average down entry price. This option is now well out-the-money. The trade idea is to give more than 3 years for the new CEO to do his thing (and also for the European Central Bank to raise rates a few times)
Let's look at the chart I presented last time I bought this call option - the blue rays show the bought call and the profit lines. The pink ray is the new 200% profit line for this contract which is just below the breakeven for the original contract.

It is clear that the stock did not follow through on the blue arrow run I had been looking for. I fully expect to see some consolidation from the current lows and then would expect to see a repeat of one of the run ups. I have simply used the shape of the blue arrow and painted it pink. It could start soon but more likely it will take a few months to go ahead - there is time on the chart for the run to begin into 2019 or even early 2020 to complete before expiry in December 2021.
ENGIE SA (ENGI.PA): French Utility. Engie came up on a Price to Book Valuations screen with a Price to Book Value of less than 1 (0.92) and a new one month high. What attracted me was its mix of business between traditional power generation and renewable power generation - building on a clean power theme for years to come. Dividend yield of 4.98% is a nice bonus.
The chart is a classic chart of a business that has been beaten up, has taken the restructuring pain and has broken back up, and now retested support in the most recent selloff.

The risk in the stock lies in the high debt to equity ratio of 91% (69% for long term debt). Note: the ratio is lower than industry average. Interest cover is a respectable 53% - not too scary. [Means: Amount of income available to cover interest charges]
Sold
SAS AB (SAS.SK): European Airline. Profit taking sale to fund margin requirements in account used for currency options trade. 6.9% profit since June 2017.
Shorts
Euribor 3 Month Interest Rate Futures (IZ0): I have been wrong in recent time on European interest rates - they just seem to want to go lower again. Price has been testing a level for over a week now and there is a solid resistance zone above this level. I added one more short contract - there is one rate rise on this chart from current price to the bottom.

I have until December 2020 to be right.
Cryptocurency
Bitcoin (BTCUSD): Price range for the day was $564 (7.8% of the high) which is around the average level. The chart tells me of a disappointing day for Bitcoin bulls as price made a new high and then headed off to make a new low and close forming a bearish engulfing bar. This does not often happen and it is commonly a very bearish reversal signal.
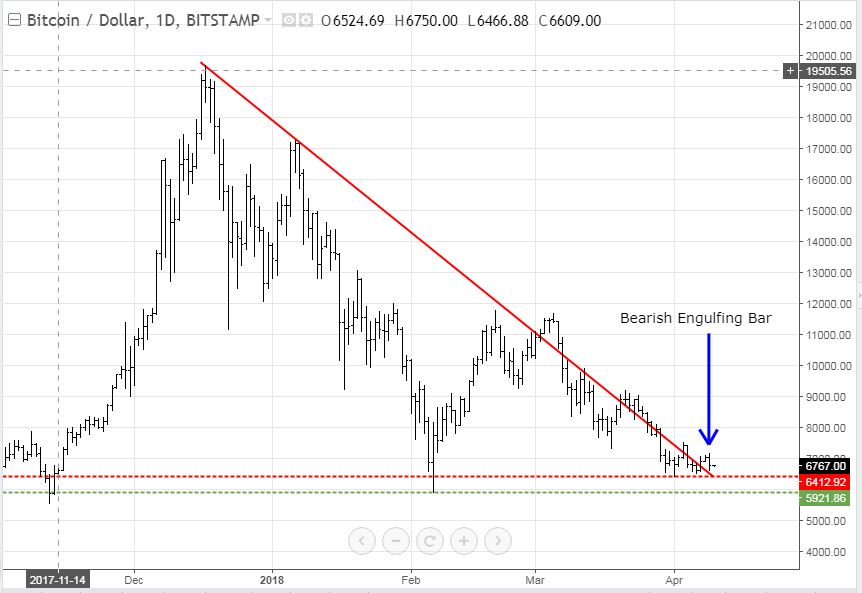
The support level did hold.
CryptoBots
Outsourced Bot No closed trades on this account. Problem children (>10% down) list was unchanged - ETH, ZEC, DASH, NEO, ENG, EOS, STRAT, ETC, XLM, ADA, QTUM, BTG, ARK, GAS, OMG.
One NEO trade has dropped below 10% down.
Profit Trailer Bot I switched over the trading to Ethereum pairs. For the coins that were on the DCA list, I put pending orders at 15% above current price and I will hold that line till they all close. This means that I am locking in a stop loss level to get out of 5 out of 7 coins at a loss (XMR and HSR will break even).
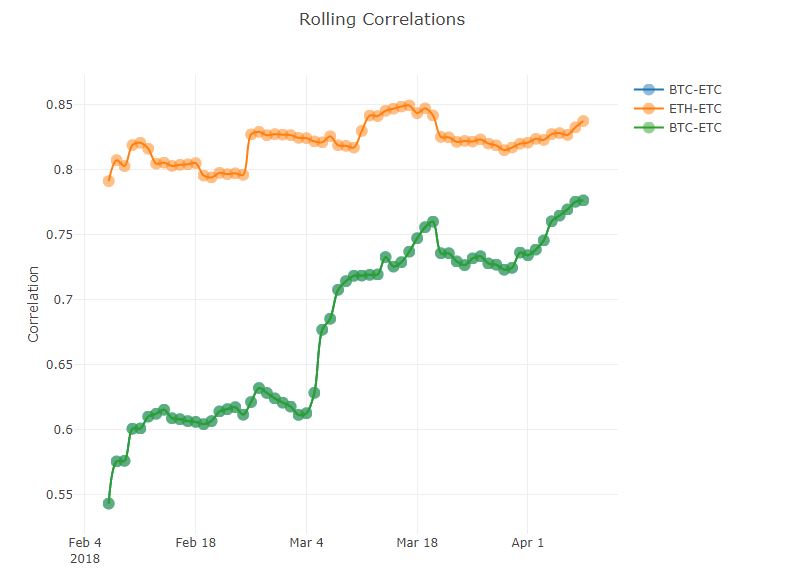
The concept I am applying has to do with correlations on coins trading against Bitcoin compared with Ethereum. I have been seeing that when Bitcoin falls hard altcoins fall harder than they do when compared with Ethereum. One chart will show this - I have plotted one altcoin (LSK) against Bitcoin (green line) and against Ethereum (orange line).

The orange line is flatter than the green line - i.e., it is less volatile.
https://www.sifrdata.com/cryptocurrency-rolling-correlations/
If you do not believe me, try the chart yourself or look at this one - Ethereum Classic (ETC) - the Ethereum based chart is a lot flatter.
The second part of the strategy is I want to be holding Bitcoin long term - why then run a trading robot that is continually selling Bitcoin for other coins.?
I have started out the bot on a smaller scale to test things out. It did make winning trades averaging 1.19%

Dollar Cost Average (DCA) list has one coin on it and it has not made any DCA purchases. I am operating at 3 levels of DCA (-3.25, -5.25, -7.75). I have also added a stop loss level at -14.75%. The idea is to protect the bot from landing up with 6 or 7 coins in DCA. Rather cap losses at a level and rely on a flow of steady winners.
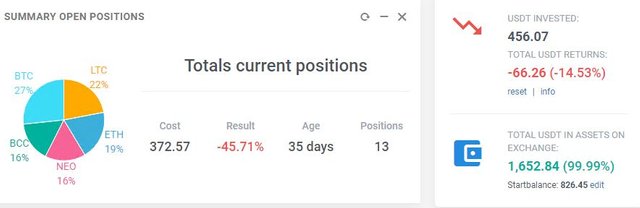
New Trading Bot No change as this is now under buy and hold management and the bot is not trading. Overall loss average is worse at -45% (was -44%) with NEO still the worst performer at -58% and -63%. Best performer is BTC at -31% (was -30%)
Currency Trades
Chinese Renmimbi (USDCNH): I saw the article about the potential for China to devalue its currency as part of its trade war response. This is an easy way to mitigate the effects of tariffs on trade. I bought a one year to expiry 6.3075 strike call option for 0.17862 premium. Let's see how this looks on a chart which shows the bought call (6.3075) and 100% profit as blue rays with the expiry date the dotted green line on the right margin
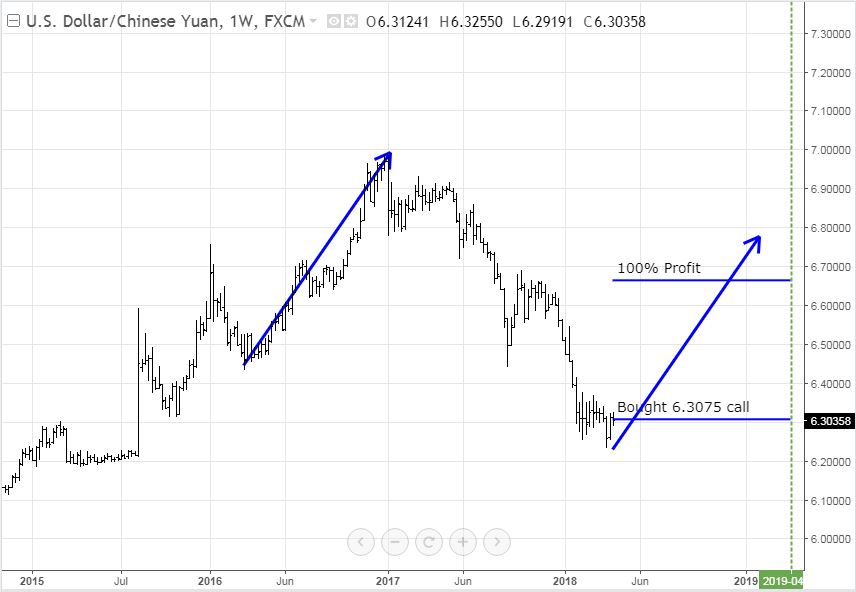
The PBOC manages its currency quite actively and are adept at keeping it in a range (see 2015) or allowing it to weaken (2016) or allowing it to strengthen (see 2017). That tells me that if they want to weaken the currency for trade purposes, they can. What the trade needs is a run like the 2016 run (the left hand blue arrow) and 100% profit will be made.
The current consolidation looks like a good foundation for that to work through. The challenging part of this trade is the US Dollar leg. Normally we would see the US Dollar rising as interest rates rise (i.e., the chart would go up). Interest rates in US have been rising but the chart has been falling. Mostly this can be attributed to sales by China of US Treasuries - this is their tariff trade trump card. They own a very large slice of US Treasuries.
Note: I am holding a few other USDCNH options trades. Last one was written up in TIB165 - it is underwater but there is still time to go. I just need price to go back half way to the highs.
Forex Robot did not close any trades and is trading at a negative equity level of 13.3% (higher than prior day's 12.4%).
Outsourced MAM account Outsourced forex trading account with Actions to Wealth closed out 2 trades for 0.04% profits for the day.
Cautions: This is not financial advice. You need to consider your own financial position and take your own advice before you follow any of my ideas
Images: I own the rights to use and edit the Buy Sell image. News headlines come from Bloomberg.com. Correlation charts are credited below the images. All other images are created using my various trading and charting platforms. They are all my own work
Tickers: I monitor my portfolios using Yahoo Finance. The ticker symbols used are Yahoo Finance tickers
Charts: http://mymark.mx/TradingView - this is a free charting package. I have a Pro subscription to get access to real time forex prices
Bitcoin: Get started with mining Bitcoin for as little as $25 http://mymark.mx/Galaxy
April 9, 2018
Amazing @carrinm