TIB: Today I Bought (and Sold) - An Investors Journal #152 - Shift Debit, UK Bank, Europe Technology, US Retail, Bitcoin Futures
There is a positive buzz about the markets. The talking heads are all going on about Bitcoin ever more with the launch of Bitcoin Futures. Retail continues to march ahead and a few beaten up stocks poke their heads above the parapets. And I still have time to explore new trading strategies.

Bought
iShares STOXX Europe 600 Technology (EXV3.DE): Europe Technology. One of the reasons that Eurostoxx 50 (top 50 European stocks) has lagged the S&P 500 is that there are not many technology stocks in the ESTX50. I have known that for ages but have not done anything about it especially as I had added technology exposure in US and China. Yesterday there was a big takeover bid for Gemalto by Atos - two European technology businesses - and the bid premium was a massive 35% or so. That got me to thinking about adding European technology to my portfolios and taking out some Index level holdings.
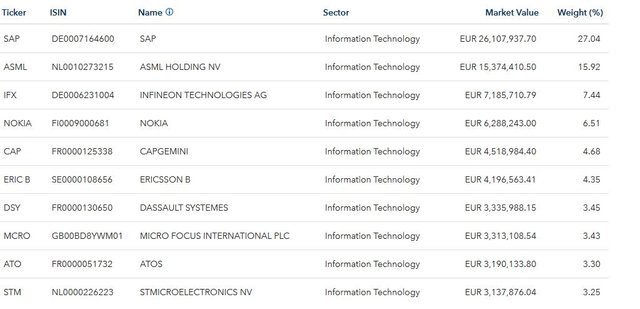
I found this ETF that tracks the STOXX Europe 600 Technology index. These are the Top 10 holdings which account for nearly 80% of the fund. The names are all quite familiar to me
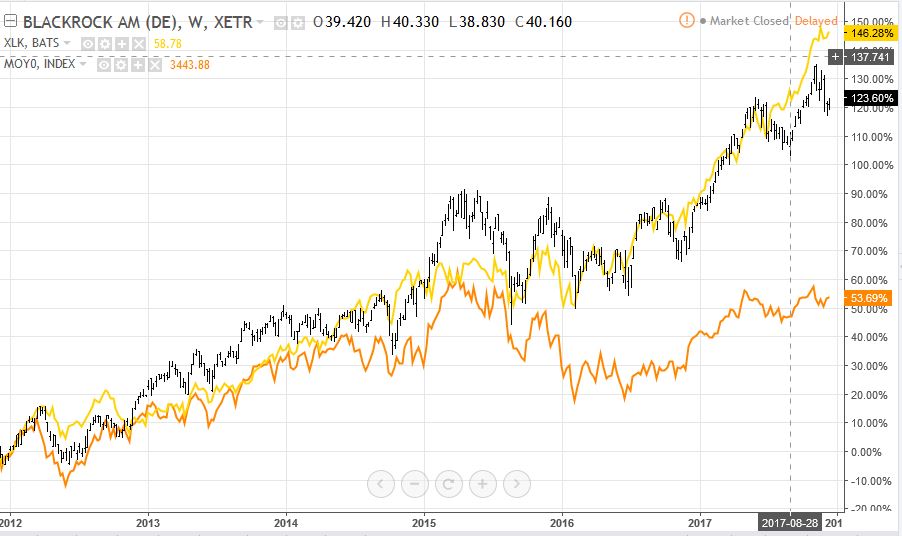
Now this might be a case of closing the stable door after the horse has bolted. Let's look at the chart which compares EXV3 (black bars) to Eurstoxx50 (orange line) and US technology (XLK - yellow line). Be warned there is a currency effect in the chart as XLK is in US Dollars and the others are in Euros. The chart runs from the European Debt Crisis low. Technology stocks have certainly outperformed ESTX50 (72% for EXV3). There is a gap of 20 percentage points between the two sets of tech stocks. I did miss the boat in Europe. This trade tries to close the gap and we shall see what time will deliver over the next 5 years.
Metropolitan Bank Holding Corp (MCB): US Bank. MetroBank recently listed. It is a New York bank billing itself as the bank for entrepreneurs and online. I bought it because they issue the Shift Debit card which allows you to use a debit card against Bitcoin balances. What excites me is that if you have Coinbase, who are signing up 100,000 new Bitcoin accounts a month, selling your cards, this is a new business channel with a lot of exciting young people coming into it.

Image from Eugene Moseley Youtube video
Dick's Sporting Goods (DKS): US Retailer. I bought an options trading course which had some specific criteria for choosing stocks. This got me working out how to run an automatic stock screener using my preferred charting package (TradingView.com). While I was learning, I programmed in all my favourite screens - Price to Book; Price to Sales; Price Earnings. What the screen does is identify candidate stocks on fundamentals (e.g., Price to Book less than 1) and technicals (Break ups: Moving averages stacked with 50 lowest, then 20 then 200) and price at a new 1 month high. This then tells me that price has bottomed out and has broken up. Here is a chart for Dick's Sporting Goods.
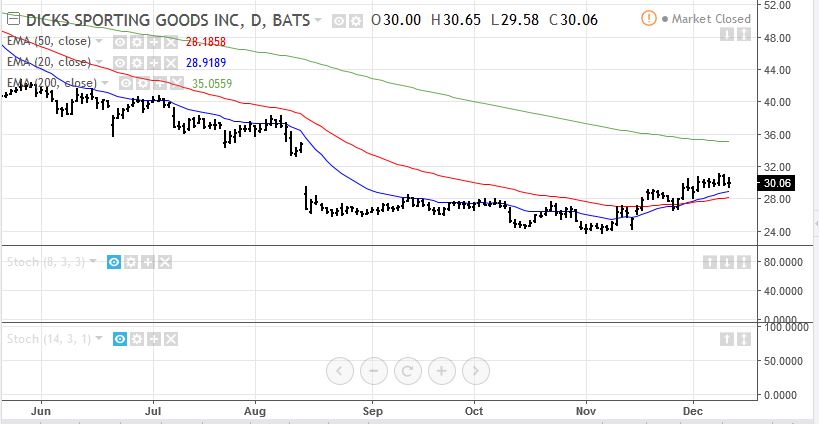
What I like is I can now apply this to all markets across the world in a single platform.
Implied volatility for the January 2020 call options was higher than I wanted to pay so I bought a January 2020 30/37 bull call spread for a net $2.50 premium. [Means: Bought strike 30 call options and sold strike 37 call options with the same expiry]. At the time of the purchase, price was just below $30. Let's look at a chart which shows the bought call (30), breakeven, and 100% profit as blue rays and the sold call (37) as a red ray with the expiry date the dotted green line on the right margin.
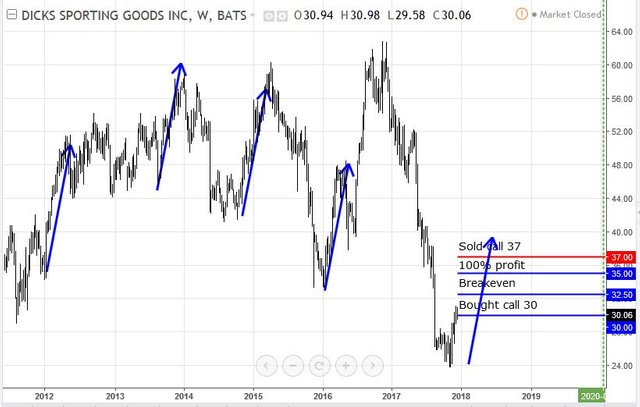
DKS has certainly been smashed down since the start of 2017. Price has shown signs of recovery. I have cloned one of the run-ups (the last one). As you can see this is about the same length and steepness for 4 of the last 5 runs. If that repeats from now - or even in a few months from now, price will comfortably take the trade to maximum profit (180%). This is only one third of the way back to 2017 highs
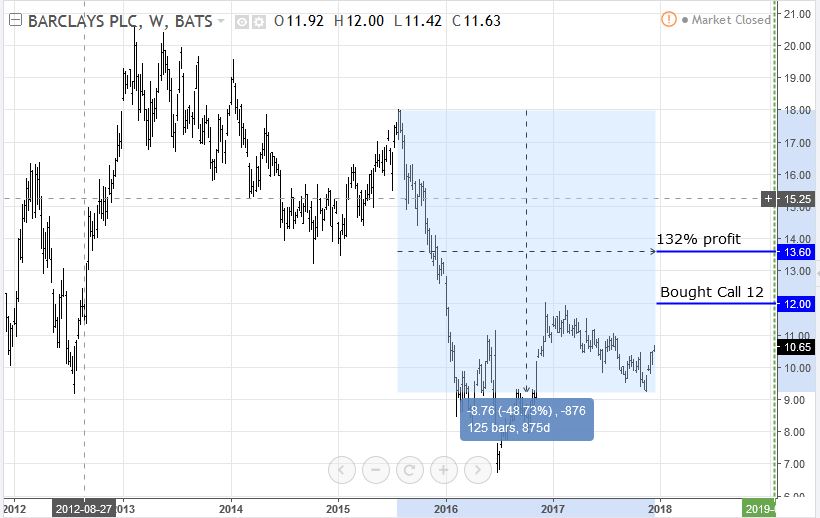
Barclays plc (BCS): UK Bank - US listing. Barclays appeared on the Price to Book screens too with a nice break up in price. I do hold Barclays stock in one of my portfolios. For this trade I was looking to add some asymmtery to that holding. Next strike up for January 2019 call options is 12 which is a bit of a stretch from the closing price of $10.65. That explains why the premium was only $0.70 (5.8% of strike). The chart shows the bought call (12) as a blue ray and expiry is on the right hand margin. Price has only to get half way back to the last highs (measured by the blue box) to make a 132% profit. Another run like the one from the Brexit lows will make it a winner.
I also bought on the UK market a shorter dated March 2018 strike 1.9 call option. This option is in-the-money as price is over £2.00. I am testing the London market as a way to run trend continuation trades as well. This time the trade is for an upward trend and one strike in-the-money.
JC Penney (JCP): US Retail. I deployed the proceeds of the retail ETF trade into JC Penney in the one portfolio I had not added it. I had to do things a little differently here as I am not permitted to hold short positions. So I bought some shares and then bought a January 2020 3.5/7 bull call spread for a $0.66 net premium. This offers a 430% return if price reaches $7 by expiry in just over 2 years from now - keep spending Americans.
Sold
iShares MSCI Europe ex-UK ETF (IQQU.DE): Europe Index excl UK. I bought this index ETF directly after the Brexit vote (4 days) as I wanted Europe exposure without UK. I sold this holding 26% profit since June 2016 to release funds for the Europe Technology purchase.
SPDR S&P Retail ETF (XRT): US Retail. Sold January 2019 strike 42 call option as price has now passed through the strike price on the next call option in the staircase of options I am holding ($44.19 closing price). Tidy 62% profit since July 2017. I deployed the proceeds specifically into JC Penney (see above)
Axa SA (CS.PA): French Insurer. Rolled up December 2017 strike 24 call options. Price (€25.53 - Dec 12 close) has passed 24 strike price coming up to this week's expiry but has not recovered the option premium. What I had been hoping for was price to rise at least 15% since March 2015 - it did not. Banked half the premium and used half to go out one more month and one strike higher but still in-the-money. 33% loss since March 2015. I am banking on Mr Draghi saying the right things at the upcoming ECB meeting.
BASF AG (BAS.DE): German Chemicals. Rolled up December 2017 strike 92 call options. Price (€94.11 - Dec 12 close) has passed strike price coming up to this week's expiry but has not recovered the option premium. What I had been hoping for was price to rise at least 15% since May 2015 - it did not. Banked one third of the premium and used the balance to go out two more months and one strike higher. This new option is out-the-money. 73% loss since May 2015
Münchener Ruchversicherung (MUV2.DE): German Re-insurer. Rolled up December 2017 strike 180 call options. Price (€184.90 - Dec 12 close) has passed strike price coming up to this week's expiry but has not recovered the option premium. What I had been hoping for was price to rise at least 15% since May 2015 - it did not. Used the whole premium to go out two more months and one strike higher. This new option is just out-the-money. 68% loss since May 2015
Now I do believe that my original thesis for each of these stocks was right. I just ran out of time. I could have chosen to be exercised and to take delivery of the stock. I did not want to commit that amount of capital - in fact, I do not have enough to take them all in.
There are some lessons in these trades
- I would have been a whole lot better rolling these contracts 3 or 4 weeks earlier. The closer one gets to expiry the smaller the gap between the option price and the amount the option is in-the-money. This is called theta - time decay.
- Time is the enemy in options investing - these contracts were set up more than 2 years ago and that was not enough time. Right idea but not enough time
- I might be deluding myself believing that these time extensions will actually recover the losses. Time will tell.
Shorts
Newell Brands (NWL): US Consumer Manufacturer. Am testing out a new options trading strategy. It basically looks for trend continuations. In this case, Newell has been trending down steadily since the middle of 2017. The strategy looks for reversals and overbought/oversold signals to identify 45 day ahead option entries. I will write this up a bit further once I have solid results.
Cryptocurency
Bitcoin Futures (GXBT/G8): I saw a flash on my Interactive Brokers login that they were offering the newly listed CBOE Bitcoin Futures. A bit about the product. They offer 3 contracts with 1, 2 or 3 months to expiry. Trade size is equivalent of 1 Bitcoin. Trade is cash settled. Margin at IB is high. I wanted to test the market and spreads compared to the CFD trading I have been doing at IG Markets. Spreads between bid and ask range from $80 to $150 but it is possible to set a limit price anywhere you want and benefit from changes in spread that way. I purchased 2 contracts on February expiry as the gap between Janauary and February expiries was lowest. Time will tell.
The tough part compared to CFD trading is I had to fork out the whole contract value. Good part is I was able to make a trade while IG Markets was not making markets. Time will tell if the 5.5% premium over the spot price will be recovered in the two months to expiry. What I do know is I would have paid 2.76% in CFD financing costs if I had bought the Bitcoin as a CFD.
Ethereum (ETHUSD): Etherem made a huge break up. I wanted to buy some more at the mid-point consolidation but my broker was not allowing that.
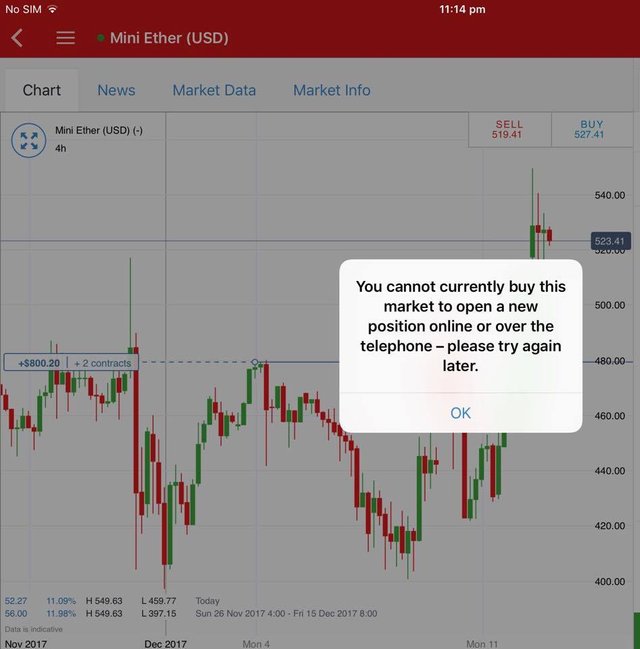
The chart shows the consolidation zone on a 4 hour timeframe. Too bad as the next chart shows what happened.
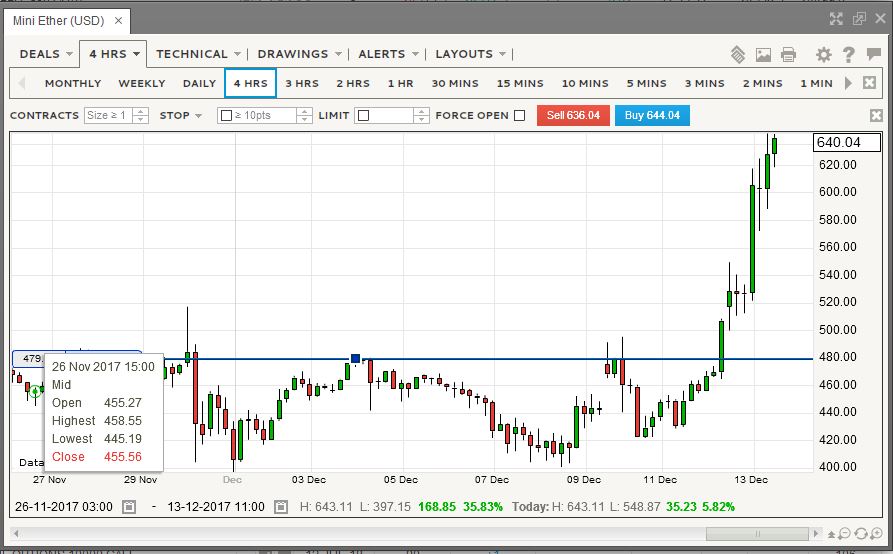
I have been thinking about trailing a stop loss or closing half the position. I just have an instinct that this is going to run a whole lot harder and I might not be able to get back on.
Currency Trades
Forex Robot did not close trades and is trading at a negative equity level of 4.2% (lower than prior day's 5.5%).
Cautions: This is not financial advice. You need to consider your own financial position and take your own advice before you follow any of my ideas
Images: I own the rights to use and edit the Buy Sell image. EXVR images comes from iShares. All other images are created using my various trading and charting platforms. They are all my own work
Tickers: I monitor my portfolios using Yahoo Finance. The ticker symbols used are Yahoo Finance tickers
Charts: http://mymark.mx/TradingView - this is a free charting package. I have a Pro subscription to get access to real time forex prices. I love the screener now that I have invested the time
Bitcoin: If you want a low cost way to enter Bitcoin, you can buy a package for as low as €50 (in Bitcoin) and earn Bitcoin at a rate way better than your bank could offer - think weeks instead of months. http://mymark.mx/Mark
December 11-12, 2017
Nice information thanks
Upvote my comments and follow by follow.
Thanks. Be aware as a new person to Steemit that asking follow for follow and for upvotes is frowned upon as bad practice. It is easy to be subtle Just write "I am new here. I liked your post" Adding some value to the post might get an upvote too if other see that comment as adding value too
Thanks alot to inform me.
I am new at steemit. I liked your post.