Oroville Dam at app. 3,050,000 acre feet....
The normal hourly data read-out is still messed up and useless (as you can tell, as this useless data shows up on the messed up charts you will see in the second link below) but, there are some daily graphs that still seem to be reporting reasonable information.
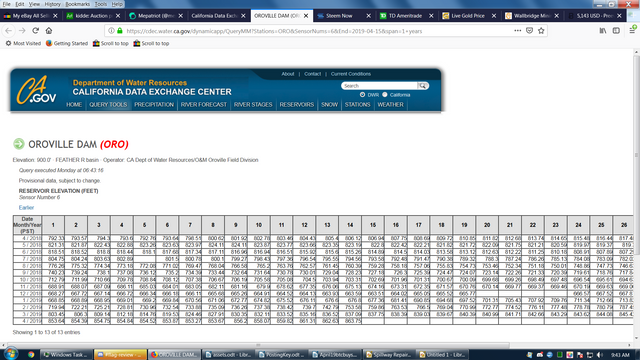
Here is the bad daily data the California Department of Water Resources (DWR) has the temerity to present to the public, given their notorious and multiple FAILURES at this dam:
http://cdec.water.ca.gov/dynamicapp/QueryF?s=ORO
This is the link I'd like you all to take a look at:
http://cdec.water.ca.gov/dynamicapp/sensorplots?staid=oro&dur_code=D
You can see the wild gyrations on some of these charts, that start at the exact time DWR decided to mess up the data, BUT...the fourth one down looks OK, and is still apparently updating daily:
This suggests that the water elevation behind the dam is now at (or soon will be at) 3,050,000 acre feet (AF). The storage capacity of Oroville Dam is just over 3,500,000 AF, so we are over 87% full right now. There is an inch of rain due in the catchment area of Oroville Dam tomorrow, and the spring melt is NOT over, by a long stretch. During the crisis of 2017, there were days when the AF storage increased by more than 100,000 AF per day--even with a heavy outflow from the main spillway. If the main spillway is unusable beyond-say- 25,000 CFS, then...well...NOT GOOD. (An AF, is simply the amount of water needed to flood an acre of area one foot deep...equivalent to 43,681 cubic feet.) Whenever inflows exceed outflows by 43,681 cubic feet (which happened every SECOND during the 2017 crisis,) one AF is added to the storage levels.
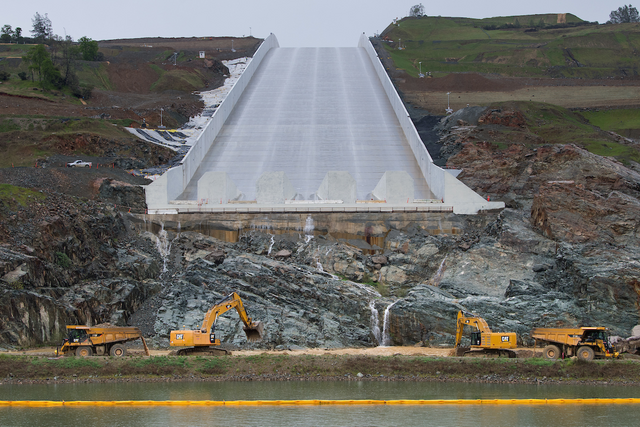
(Image courtesy of mavensnotebook.com.)
Without ANY working webcams (the one that sometimes works is off line again this morning) and no easy-to-follow data, there is no way for the citizens downstream of this huge dam to know what is going on without direct reports from locals. (A worst case scenario would flood Sacramento 10-12" deep in many areas of the City, and of course, wreak TOTAL HAVOC north of there.)
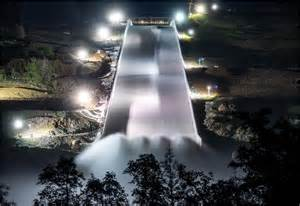
The main spillway--if we get rain there this Saturday as well, which is also predicted by the NWS-- could be needed to run well over the 25,000 CFS of the recent "test." Presumably, they will remove the scaffolding inside the spillway--if they can--before opening those damaged gates again.
I am NOT saying the dam is doomed. I'm not even saying the main spillway is seriously damaged. I am merely saying that WE CAN NO LONGER TRUST THE AUTHORITIES when it comes to Oroville Dam, and that citizen reporters MUST make themselves available to fill in the information gaps.
Edited to add: It now appears they've taken down the ability to create those charts as well.
Keep querying there though. Sometimes you can still get SOMETHING. Like this:

Which shows they are REFUSING to give water levels at Oroville now for the past four days and counting...
===============
Here's another query method showing the same negligence about reporting water levels:
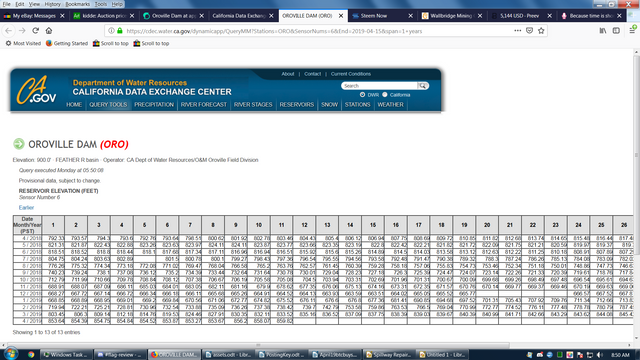
LATE UPDATE: They must be reading my blog and feeling guilty. They've now decided to update the data. We are at 863.75 feet of water elevation as of yesterday, as you can see in the screenshot: