[Indexes, Currencies, Commodities, Cryptocurrencies] Nothing to see here, but maybe uptrend in all (---USD) pairs
Equities might bottom out and appreciate from here, or simply fall further, thanks to the 'Trade War' between China and US.
This is an addition or update to this previous post:
https://steemit.com/trading/@az-charts/indexes-and-currencies-and-commodities-and-cryptocurrencies-s-and-p-to-3000-3300-eurusd-1-50-oil-to-80usd-100usd-bitcoin-and
China has a lot of 'Shadow Lending', which means sometimes it can happen that the same good (land, apartment) can be used to borrow money more than once. This 'Shadow Lending' coupled with 'Margin Debt' lead to the 2015 financial crisis where hang seng plunged by 30% at least, which resulted in a wide correction across all equities, with an average of 20% drawdown from current highs.
Here is the documentation:
https://www.zerohedge.com/news/2018-02-12/bis-publishes-simplified-map-chinas-shadow-banking-system
https://www.zerohedge.com/news/2015-06-25/biggest-threat-chinese-stocks-shadow-lending-crackdown
https://www.zerohedge.com/news/2014-06-27/why-nyse-margin-debt-meaningless-new-shadow-banking-normal
On a side note, here is JPM outlook on the current market situation:
https://www.zerohedge.com/news/2018-03-24/jpmorgan-we-see-risk-institutional-capitulation
To quote from the article:
"Meanwhile, more ominously, JPM had noted that no matter what retail investors did, institutions appeared to have no interest in re-entering the market, on the contrary, they appeared to be quietly liquidating to retail investors, a trend which incidentally started around the time of the last market peak in 2007, and hasn't changed since."
Also consider, if 'protests' continue:
https://www.zerohedge.com/news/2018-03-24/what-democracy-looks-500000-people-storm-washington-during-march-our-lives
This means two events can happen if or when it reaches 2500 level:
-Someone shows fiscal stimulus package (FED), lowers rates, or puts a very good government project that would make a lot of companies rich ( see 1tn infrastructure project of building highways, or, simply "Build the Wall" )
-Nothing happens, possibly even bad news, it continues to plunge all the way to 2380-2400, or even much lower, towards 2000. If nobody saves it(Plunge Protection Team) or enters at 2380-2400 then it goes further down. To note, if market drops hard, circuit breakers go so drop will not go further than 10% in a day;
Good news for the next week can make it good. However, considering 2017, which was a good year, this year might not look as good, considering, by some, lack of strength to gather past performance. At best, it can be a transitioning year, when things don't move a lot, but in the end, for the market, it might mean new highs, while, at it's worst, could be the start of a financial crash and more instability. The way things have been going for the past months, some would say the time when things don't look good might be approaching. At it's best, calm relations between the world states would make an average good transition to further growth. For the major equities, at this point in time, this would result in an appreciation of 20% on average.
Now, let's see some levels
S&P.
At a 2-4% drop from current levels, it might give an average space for a consolidation and a good spot for a lot of people to buy. Similar, for a 7% drop. For a longer term hold, a lot of people would buy it after a 20% drop. It wouldn't be surprising if 'they' would blame it on Trump.
All the major scenarios are clearly represented through arrows.
Levels like 3000 or 3300 for spx are overextended and way too optimistic. But despite it, there might be room for surprises.
Levels:
- 3000 and above, bubble territory
- 2800-2900 - yearly resistance
- 2500 - yearly average of previous year and yearly support
- 2370 - yearly support
- 2100 - yearly support
Sideways means 2500 - 2800. Down means below 2500. Up means above 2900 with intent to reach 3000 or higher.
Scenario 1: Sideways then up or up from here
Scenario 2: Sideways then down
Scenario 3: Down, then sideways up from that level
Last time(previous month), scenario 3 happened. At this point in time, all 3 narratives seem to be dominant in their own way, if you focus on one. If 'they sell' then scenario 3 is most likely. If they don't, then scenario 1 is most likely.
Scenario 2 could happen if 'plans' to achieve either 'trade war' or 'infrastructure projects' are lagging.
Another good thing to note:
https://www.bloomberg.com/news/articles/2018-03-23/trump-wanted-a-trade-war-here-s-what-one-looks-like-quicktake
Trade wars can actually create a form of inflation on countries who accept imports. Prices rise by a certain amount for the goods that are bought from that exporting country. In short, the price of goods can rise in that country who imposes tariffs. This is a form of an artificial inflation, which can easily be stopped, as soon as tariffs are dropped.
In short, tariffs on foreign goods creates an artificial price increase for the goods, which in turn can weaken the currency, thanks to prices rising. The exporter country would be affected with less demand for their products.
What happens is, in the home country(US), the value of the currency(USD) might drop a little.
And in the foreign exporting country(China), the value of the stock of the exporting companies might drop a bit more than a little(think a lot). Think about that 'shadow lending', and what happens, is that debt piles up, and can't be repaid in some circumstances, because of loss of revenue. Thus, this might spark the next financial crisis.
The objective of Trump here, is not necessarily to create a financial crisis in China, but for the Communist Party to drop their own tariffs imposed on US Goods. If China drops tariffs, then US economy gets better exports, thus an increase in Equity and Indexes. If China keeps tariffs, nothing new for the US, but Chinese companies start to suffer. They will have nowhere to produce their stuff and they will not have the ability to get foreign currencies in their balance sheets.
Considering the past situation, the tariffs are good. The trade balance starts to be balanced between US and China. Right now it's merely balanced.
- Chinese drop tariffs -> Good for US equities, USD rises, rate hikes might drop
- Trump keeps tariffs -> Bad for Chinese equities, USD drops a bit, more rate hikes
The prospect of Hang Seng dropping at 2015 lows might seem more likely if China doesn't drop tariffs.
And there isn't much more space for growth, for it, at this point in time. It's already at all time highs and in bubble territory.
Currencies:
As for currencies, CNY might appreciate a bit( usdcny to 6.10 or to 5.90), and Chinese Debt can spiral out of control.
If not, return to yearly support, 6.60.
On the other hand, exotics like TRY can stay negative compared to USD or can further devalue;
See how USDTRY appreciated for the past 5 years, since 2013:
Meanwhile, EURUSD on the verge of breakout upwards, or on the verge of a correction, to a downtrend:
If trade wars with EU are initiated:
-Euro might start appreciating and Usd depreciating. Reason? Euro gets stronger thanks to artificial inflation, thanks to tariffs.
To clarify:
- US -> EU => EU stocks downtrend, Euro demand( EUR up) due to slight lack of demand in production
- EU -> US => US stocks downtrend, Usd demand(but less, due to existing downtrend)
China increasing trade with EU, or dropping tariffs:
- CN -> EU => EU stocks uptrend, can be Euro demand
- EU -> CN => CN stocks uptrend, can be Cny demand
Risk of Euro appreciating is minimum, more like sideways, with uncertainty whether down or up
Commodities:
Oil might continue it's appreciation, or consolidate at this price range:
Gold to continue it's downtrend, or have an abrupt appreciation:
Wheat can start an uptrend, or stay at current levels:
Tariffs means less sales of this product, thus less demand for it. But can trigger a price appreciation in the long term, thanks to tariffs, in the countries who raise them. (China setting tariffs on soybeans)
Cryptocurrencies:
Bitcoin, can increase, and can actually profit from tariffs, but mostly on sanctions, instead of tariffs.
See people using bitcoin to settle agricultural cargo, like selling Agricultural products in exchange for bitcoin, in a Turkey port.
Also, lightning network is being developed. Fees are dropped thanks to segwit.
Lightning network can tell goodbye to payment systems like visa/mastercard.
Despite all this 'future', it is currently staying in a 'sideways' mini 'bear market'.
From 11000-7000, is the range for a mini bear market.
From 7000-3000, is the range for a bear market.
Above 11000-14000, is the range for a next potential breakout.
And above it, new highs.
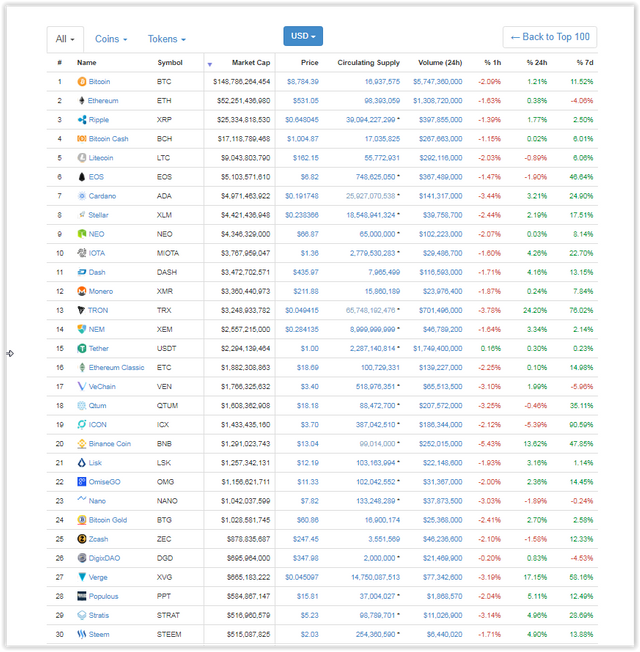
Here is a look from coinmarketcap, sorted by volume(the new contenders got volume from Upbit exchange ):
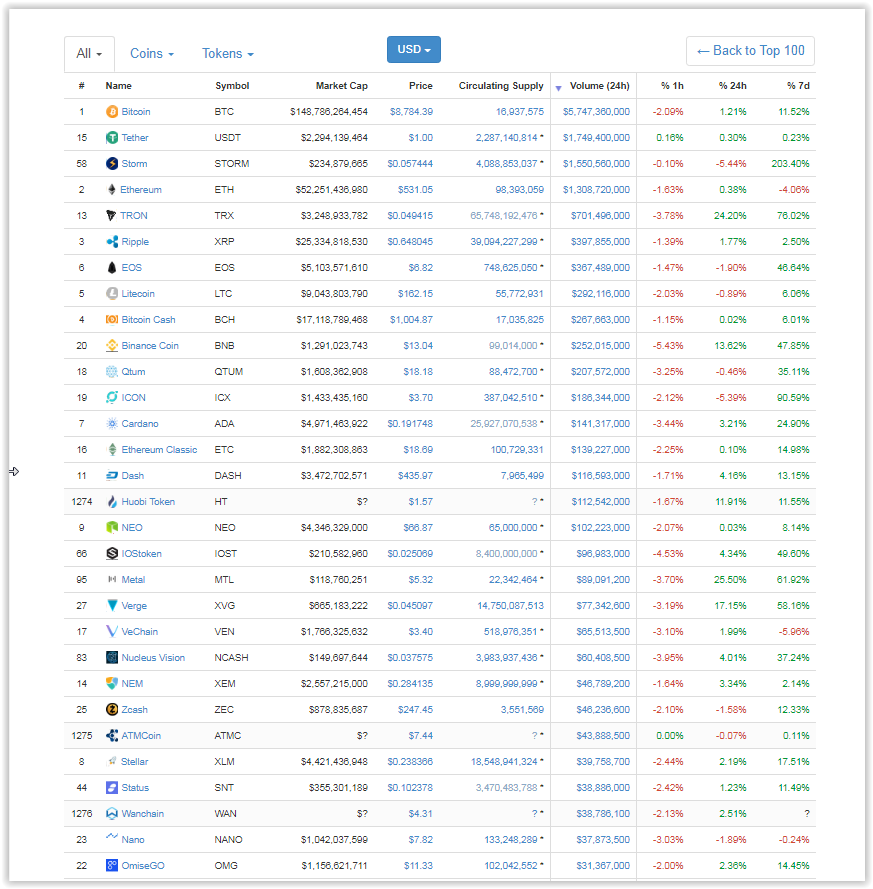
New contenders for Ethereum, Litecoin and other coins:
These are Storm and Tron.
By market cap:
Maturity of crypto and ico's should be at the end of this year.
Conclusions...
For the next quarter, another summary, but to keep it clear:
- Indexes: correction if trade wars intensify
- Currencies: USD deval, Euro appreciating, some exotics depreciating
- Commodities: following USD deval, appreciation
- Crypto: Sideways, with potential uptrend; More progress towards end of the year, if any;
For this year:
-Indexes to profit of solved trade wars and infrastructure projects
-Currencies, Commodities to keep their current trends
-Crypto can have a good run starting Q2; Though mostly Q3-Q4
Congratulations @az-charts! You have completed some achievement on Steemit and have been rewarded with new badge(s) :
Click on any badge to view your own Board of Honor on SteemitBoard.
For more information about SteemitBoard, click here
If you no longer want to receive notifications, reply to this comment with the word
STOP