Bitcoin: How to Read Those Bloody Charts? And My Short Term Prediction.
Don't Follow All the Hype
I think it's important to keep a clear head when paying attention to the news about Bitcoin prices going up and down. The media likes to dramatize things because it helps to sell clicks. One day you read "IS IT OVER FOR BITCOIN, PRICE DROPS TO $7000" and next day, "Bitcoin price increases 5%, are we back in a bull market?"
Just because they post "good news" about BTC increasing from $6,800 to $7,300 doesn't mean the storm is over. So how do you get your bearings?
Technical Analysis: The Fuzzy Crystal ball
It's not an exact science, but it will always give you a probability of what may happen next. TA is about a calculated guess, based on past experience and the psychology of what the masses may do next.
Keep in mind, I'm no expert in this an I'm always learning more, but these are the tools I use today to give me an idea of what's going on and where we may be heading.
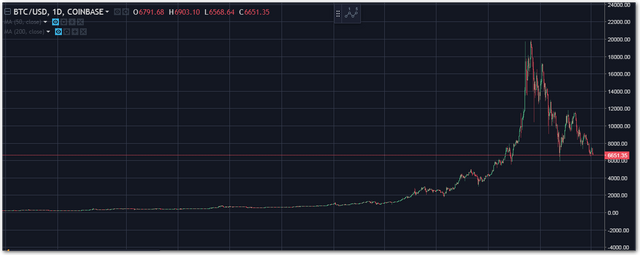
Start with the Big Picture: Day Chart
This helps me to understand where it's been and maybe where it's going. I can see how quickly it's been moving and ask myself:
- Has it been moving too quickly or slowly?
- How long has this existed on this exchange?
- Whats the biggest high it's had?
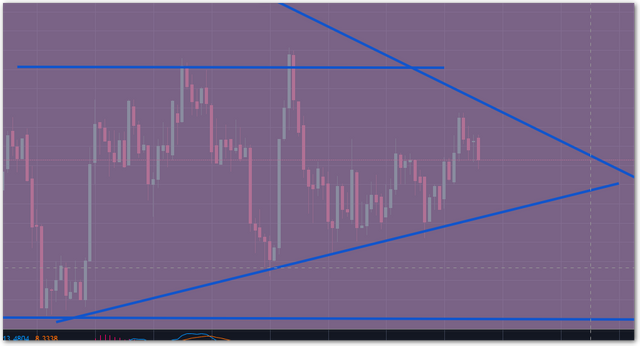
Day Chart: Trendlines
I'm not too dogmatic about these trend lines. It's just a general guide to show me the direction it's been trending. I'll draw one going up and down and I see, how many peaks do I touch on those trendlines? This shows me how relatively strong those trends are.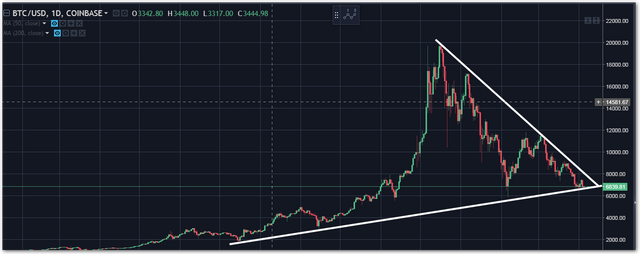
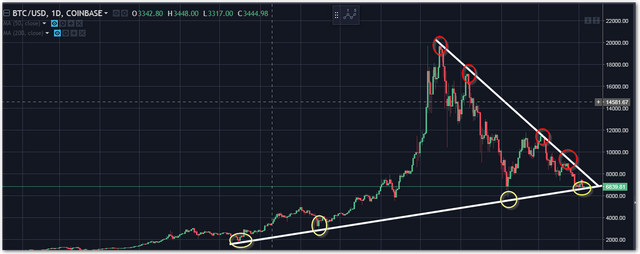
Now, when you see this type of a Triangle or a "wedge" forming, this is meaningful. This usually indicates a price "breakout" where it could shoot out dramatically in either direction. Depending who you ask, they may see this as a "rising wedge" or a "falling wedge". This is kind of hard to tell because it's not 100% clear. I look at it like an arrowhead and ask, "which way is the arrow pointing too?"
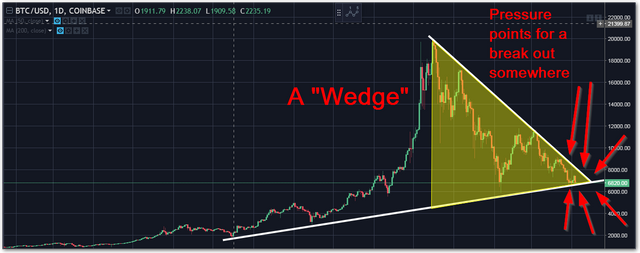
A "Rising Wedge" would indicate the price is about to reverse in the other direction, hence a price drop.

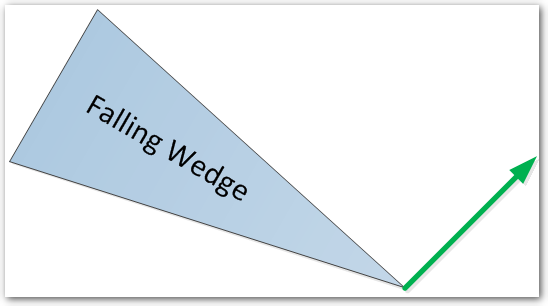
A "Falling Wedge" would indicate the opposite, the price is about to go up.
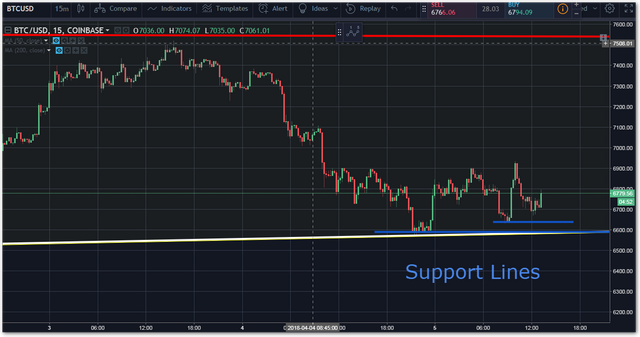
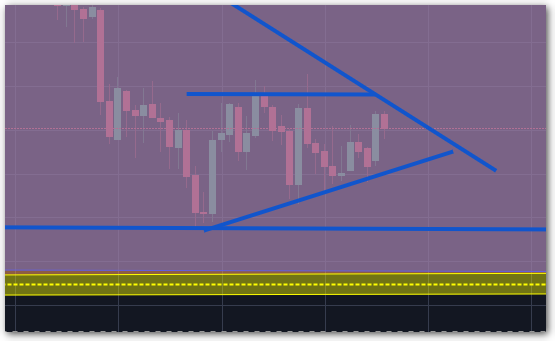
1-Hour Chart: Trend Lines and Channels
Now we can take this a bit further and look for "channels" in the chart. This is yet another way to spot resistance points. This doesn't have to be done on the 1-Hour chart only...this can be done on any timeframe.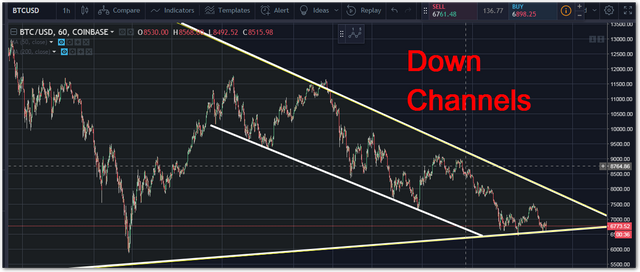
Resistance and Support Lines
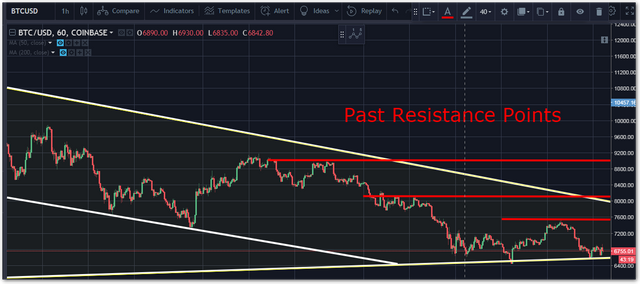
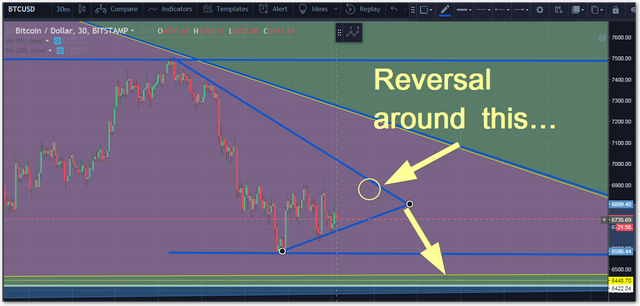
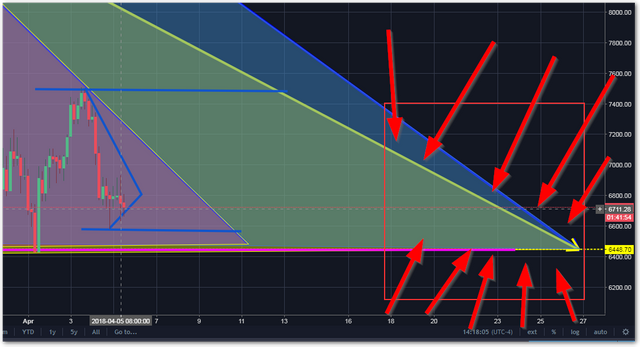
Putting It All Together
Based on all the info thus far, I'd estimate that it has temporarily hit the floor for now. It will rise to about $6,894 and then reverse back down.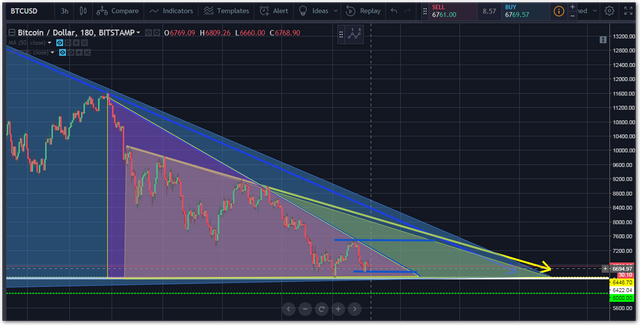
Overkill
Don't overdo it...or you'll just confuse yourself and lose track of what's going on.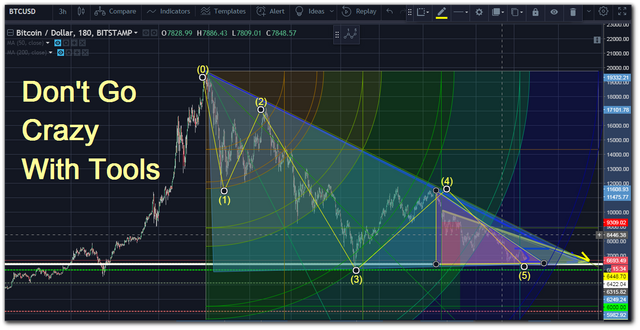
In Summary
This is how I do my technical analysis. Of course, I also look at a few other fundamental factors. Such as, what's going on in the news world. Is there FUD going on about some country going to arrest anyone dealing with Bitcoin? All those things can cause price drops as well. But, this is the basic idea.
Question:
What Tools do you use?
Legal Crap
The above references an opinion and is for information purposes only. It is not intended to be investment advice. Seek a duly licensed professional for investment advice.
Sources
- All images are of my own creation.
- Screenshots taken from Tradeview

Bitcoin will definitely recover from its dips but we just dont know when will it be. Until now, it is still struggling to reach even 10k mark.
I agree I do believe it will surpass $20k this year and maybe hit those other predicted highs of $50k. But I think there's been a loss of confidence and added competition. I think once it's been perceived as actually hitting the bottom, the whales are going to jump in and start buying like crazy, which will lead to a price increase, which will lead into perceived consumer confidence, which will lead into more people buying into BTC.
I hope this good news at 18-26th of april, thank for info
Same here, I'm keeping an eye on the price of STEEM, EOS, ONT and NEO so around that time I can hopefully get the best deals before it jumps up. If it breaks the support lines too much...then it indicates to me to wait...prices will keep dropping for a while longer. Though, this only means to me another chance for better deals.
yups ... according to your prediction, is it better to save steem or sbd? I'm new in crypto?
Well, SBD has been growing at a faster pace than STEEM. For example, right now SBD is $1.89...but looking at the past, it's gone up to $18 and STEEM was at $8. This means when you convert your SBD to STEEM you get a lot more STEEM which you can use to power up your SteemPower. That to me is my biggest objective...get more SP!
Of course, this is not financial advice...blah blah blah...trade at your own risk.
SBD goes up quicker because it has much less circulating supply in comparison so it goes up ahead of steem most of the time. but when there is a gradual decline over a period of time SBD will go below steem as there is no point in keeping SBD for longer periods it does not earn anything. but if you are keeping an eye on these, you can convert back and forth to increase your holding.
Thanks for your inner workings of how to analyze charts. I just want BTC to moon so much right now :/
You're very welcome. I want it to take off...but the greedy side of me wants the price to drop to $2,000 first, and then take off to $50k. I want that price drop so I can get more STEEM and other coins for cheap :-)
We hope cripto to the best for next week...
I think we'll still see some small ups and downs, but we won't know if the "big" reversal has started until sometime closer to the 18-26th of April. That's when the biggest amount of stress will be on that wedge.
April 16-28 is an optimistic estimate.
i hope will come true..
Haha! Yeah, my fuzzy crystal ball just tells me something big is about to happen. I wish it was a clearer rising or falling wedge. Then I'd have a higher level of confidence. But at least this level of TA helps in short trades. Buying at the support and selling at resistance points.
It's a rising wedge and sellers dominate buyers clearly. Supports are really strong but selling pressure seems stronger for now. If dynamics continue unchanged, I predict price meltdown. This could potentially go below BTC mining cost. What would happen then? It happened in 2011 and that wasn't so great I remember.
Ah, now that's interesting right there! Tell me more about this BTC mining cost issue.
I'm looking at MACD on the hourly chart, when the current upcycle runs out of steam in about 4h, while I'm asleep, I expect 6500 to be tested again. I'm not buying yet.
Though right now hourly trend is kinda turning upwards maybe it was a falling wedge? :P
Even though it's a slight uptick...I think overall it's going to drop some more. Just a gut feeling at this point.
Looks like it worked out as predicted! Not that I'm a guru...probably just lucky.
really looks like it worked out as predicted! Not that you're a lucky... probably just guru..
Congrats dude ;)
Hahahaha! Just enjoying the ride :-)
;)
"Rising Wedge" This work really makes sense. Thank you for sharing with us. I am constantly awaiting these professional detections. @truth-be-told
Yeah, no problem. Glad you liked this educational information!
its great that you are sharing this skills mate. Thank you!
Not a problem, glad this can be useful to you. Cheers!
It's definitely a rising wedge. I just cancelled a post where I made a bitcoin price melting prediction. The hourly trend is very weak on the upside and strong on the downside, you can clearly see that there is a lot more volume when the market's going down. So blood on the streets tomorrow, crypto blood!
You can find my previous analyses in my blog. I predicted this would happen 3 days ago.
The price target for a meltdown could be anywhere from 5000 to 6000 but I don't expect it to go below 5000, though I don't think anyone can know the bottom. As long as big money is going out, prices will be suppressed. The sellers are big. That's the obvious part.
Yeah, the 1-Hour chart looks pretty downish and sideways...and had that slight uptick I was kinda expecting.
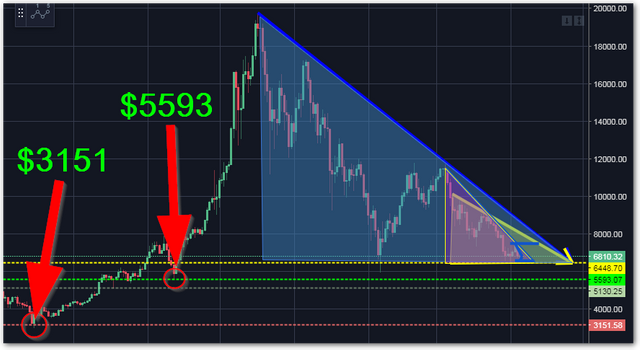
I'm keeping an eye because if it really breaks those support lines...the next fall could be around $5593 and then $3151.
Nice charts and analysis! fascinating stuff :-D
Thanks, it's pretty cool looking at these charts and seeing it react to trendlines and stuff. It's fascinating indeed. :-)
Great post! I'm new to investing in crypto and this has been useful information! Keep up the good work 👍
Thanks, glad you found this useful!
Yeah very usefull, i have been doing research on polymath. Have you ever heard of it? Seems like it could have a big upside
Nope, never heard of it...but it sounds interesting. How's it work?
They want to do what ethereum did for utility tokens but they want to do it for security tokens. Check it out and let me know what you think. I like the potential though.
Thanks looks legit
Thanks, yeah... it's kinda legit. Let's see what happens :-)
You can keep using these principles on lower charts like the 3-Min...but it does start to get a bit..."noisy". That being said, I think tonight, sometime around 2am-7am it's going to drop back down to test this support line around $6580'ish.