Ethereum Technical Analysis Price Prediction | 30.05.2023

Ethereum Technical analysis
Hello Everyone Welcome back to another Ethereum update blog
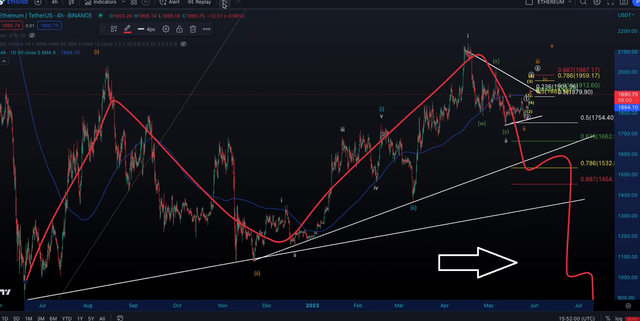
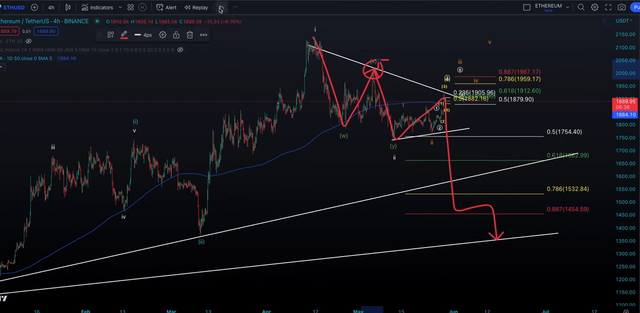
All right so my primary scenario until proven otherwise all right is that we went up in wave one in blue we came down in wave two we have now done another one-two that could have finished however it can go all the way down to 1534 and as long as we hold that level
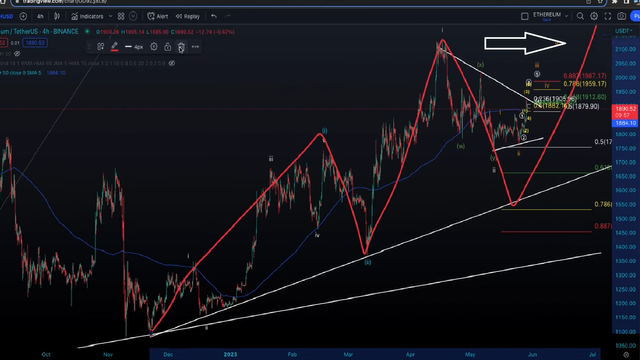
At the 7.8786 FIB level we can focus on getting a third wave to the upside right so this is the key area that we do end up needing to hold here if we are going to focus on the further upside there is another scenario
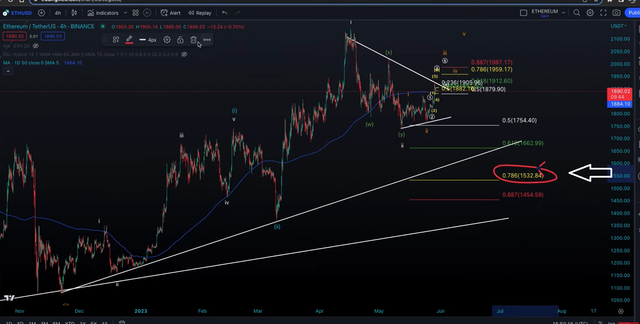
that could save ethereum if we did end up losing that level and that scenario would be actually that we went up in wave one this was a wave two then we did a three an A B C to complete a wave four and then we then actually went up in a fifth wave which would then mean that this would have to be an expanding diagonal pattern which makes it unreliable wouldn't like to you know trade that if it was going to be an expanding diagonal because the chances are well it probably wouldn't end up working out and if we end up losing that 1532 level we probably are going to go down to do new Bear Market
I can formulate another support box where if that was actually going to play out and it was an expanding diagonal pattern we could potentially copy down 2 1306 and still get a third wave from there where we could come all the way down like this and we could still get a third wave to the upside from there however it would make it less reliable and to be honest with you
I would really be focusing on the more bearish count if we ended up losing that 1532 level where we would then probably say that this was actually just a corrective structure to the upside in three waves and then we would actually be collapsing down in five waves to do new bear Market loads right so although there you know we have the option that we could potentially come all the way down to that 1300 level in my opinion if we do lose that 1532 it is going to open the door to much lower prices
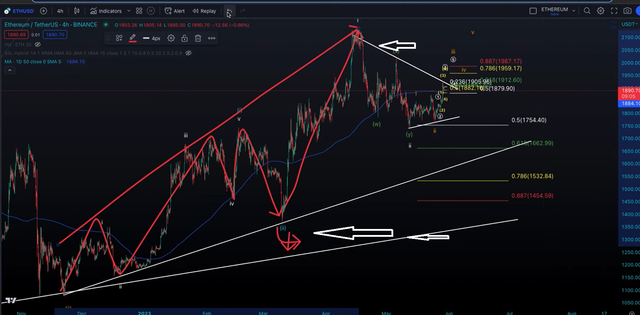
That we've got all of that out the way we are now going to focus on the potential that could be playing out now I just want to make you guys aware okay now just focusing on this area here, for now, we are still doing lower highs okay so as long as we are doing lower highs we could be looking at literally coming straight back down it will only be once we break this trend line and we get above this High here which we did have as a b wave I have changed it on my chart
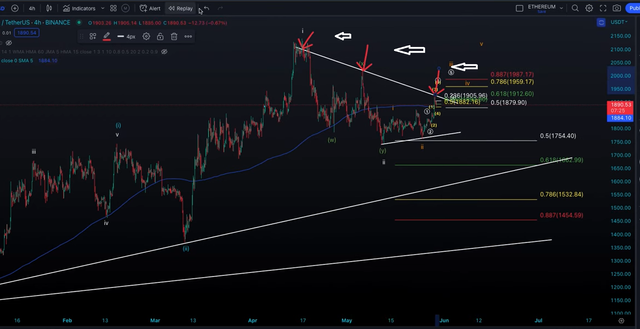
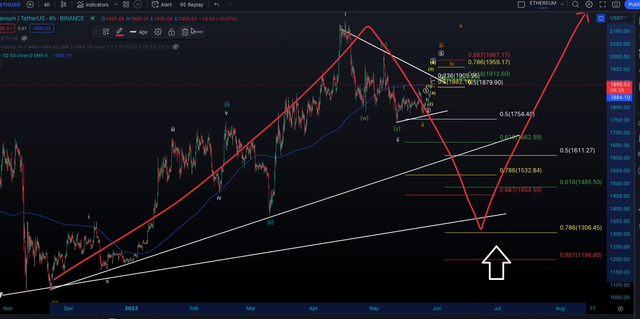
There is another scenario like I said before where we could look at this as an a wave down this is a b wave up we could potentially look at this as one of this as a wave two and we can still get a three a four and a wave 5 which would then kind of fall into probably the category of the ending diagonal pattern if we do not get above this High here this is what we really need to get above to kind of prove to us that maybe something more bullish is going on because as long as we say below here we could just look at this as a one-two and we are still going to collapse back down
I hope you guys enjoyed the post/opinion please Don't forget to upvote, resteem, and comment...