Overview Of Price Bars, How To Add Them On Charts And Identify Market Trends.
Made with LogoMaker
Price Bars
Similarly to the Japanese candlestick, Price Bars graphically showcases all transactions with regard to the demand and supply of an asset. Price Bars are thin as compared to the Japanese candlesticks, but they all portray same information, thus, showcasing the price action of an asset periodically.
Price Bars help traders to identify the market trend, on which they can rely on to initiate their orders.
Price Bars entails different time ranges, and the formation of any trend starts with a change in the Price Bars.
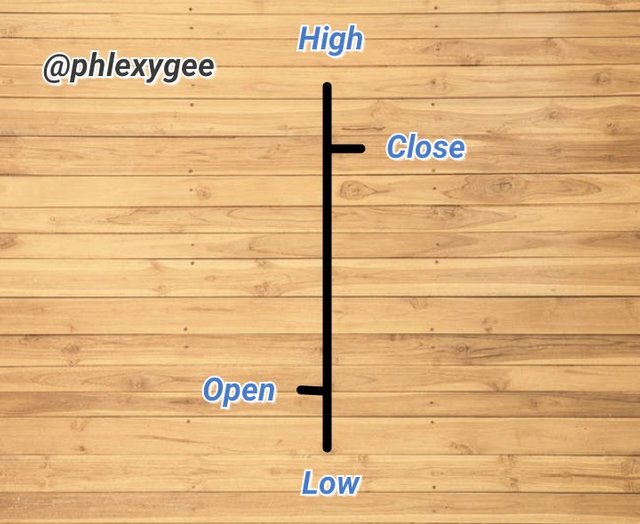
Each Price Bar consists of four components, which are; Open, Close, Low and High price, and I would like to ponder on them.
 Made with iMarker
Open; It is the opening price of an asset within a particular period of time, and It is a tiny horizontal line located at the left of the bar.
Close; It is the closing price of an asset, It is a tiny horizontal line on the right side of the bar.
Low; It entails the low price of an asset within a period of time, and it is the bottom of the tiny vertical line.
High; It entails the high price of an asset within a period of time, and it is the top section of the tiny vertical line.
How to add price bars on a Chart
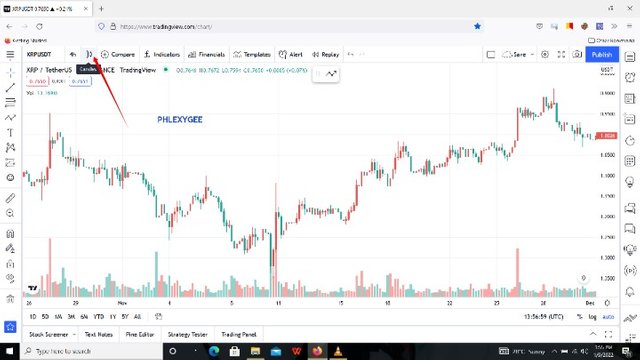
To add Price Bars on a chart, we have to select our asset pair, navigate to the top left corner of tradingview and clicked on candles.
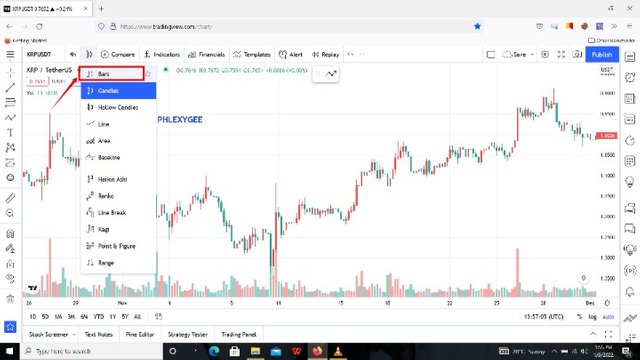
A drop-down with other options will appear, but since we are interested in Price Bars, we will click on Bars, and we will have our Price Bars on the chart as displayed below.
Price Bars displayed
.png) source
source
Note: this procedure is for tradingview, and therefore the procedure might differ on other trading platforms.
How to identify market trends using Price Bars.
As mentioned earlier, Price Bars helps to identify market trends, and these trends have to do with the formation of the Price Bars or price action.
Now let's take a look at how we can utilize Price Bars for trend identifications.
Identification of a Bullish trend Using Price Bars
To identify a Bullish trend using Price Bars, we need to make sure there is the formation and series of higher-highs and higher-lows of the Price Bars, just like identifying a trend with the price action or Japanese candlestick.
There may be instances where a few lower-highs might interrupt, since the market do not move in straight lines, but whatever the case might be, the succeeding close on the Price Bars have to be higher than the previous day's low and close.
.png)
The above is an XRP/USDT chart, and I was able to identify the Bullish trend with the help of the upward formation of the Price Bars.
Identification of a Bearish trend Using Price Bars
For us to identify a Bearish trend using Price Bars, we have to see to it that, there is the formation and series of lower-highs and lower-lows of the Price Bars, just as we identify a trend with the utilization of price action and the Japanese candlestick.
There may be instances where a few higher-highs might take place, so far as the market do not go in a straight line, but whatever the case might be, there will be a lower-low at every succeeding day which indicates the emergence of a downtrend.
The series of lower-highs are of more essence than that of the lower-lows in terms of identifying a downtrend.
.png)
The above is an XRP/USDT chart, and I was able to identify the Bearish trend with the help of the downward formation of the Price Bars.
The Bar Combinations for Spending the Day inside for both conditions.
Each crypto chart contains multiple bar combinations which can be utilized to predict future price movements.
Bar combinations serve as trading guidelines, and there are some unique combinations which helps to predict the next price movement, if only the trader is conversant with those unique bar combinations.
Now let's focus on an inside day.
An inside day is a bar that is found within the previous day's high and low price range. Thus, the previous day bar overshadows the current day's bar, with regard to its high and low.
Any price bar combinations that meet the below two criteria is considered as an inside day.
The current day's high must be lower than the previous day's high.
The current day's low must be higher than the previous day's low.
Bar Combinations for Spending the Day inside for a Bullish trend
In a bullish trend, the high of the inside day has to be lower than the previous day's bar, whiles the low of the inside day need to be higher than the previous day's low.
.png)
The above XRP/USDT chart is an example of an inside day for a Bullish trend. As we can witness that the previous bar overshadowed the inside day. The inside day has a high that is lower than the previous bar, and it's low is higher than the previous day's bar.
Bar Combinations for Spending the Day inside for a Bearish trend
With regard to the criteria, the high of the inside day need to be lower than the previous day's bar, whiles the low of the inside day need to be higher than the previous day's low.
.png)
The above XRP/USDT chart is an example of an inside day for a Bearish trend. As displayed, the previous day's bar overshadowed the inside day. The inside day has a high that is lower than the previous day's bar, and it's low is higher than the previous day's bar respectfully.
The Bar Combinations for Getting outside for the Day for both conditions
With an outside day, the high-low range of the bar is found outside the range of the previous bar, and it may signal a trend reversal or continuation depending on the location of the open and close, and the market trend.
For a Bullish trend
The Bar Combinations for Getting outside for the Day for a Bullish trend is that, the Open has to be at the low and the Close should be at the high, within an uptrend
.png)
The above XRP/USDT chart gives a clear illustration of an outside day bar for an uptrend.
For a Bearish trend
The Bar Combinations for Getting outside for the Day for a Bearish trend suggests that, the Open has to be at the high, whiles the Close should be at the low, within a downtrend.
.png)
The above XRP/USDT chart is an example of a bullish outside day bar.
The Bar Combinations for Finding the close at the open for both conditions in each trend.
The Bar combinations for finding the close at the open entails a series of bars whereby the close is found exactly at the open or near the open.
This bar combination helps to identify trend Continuation and trend reversal, just in case the open and close reach or almost reach the same price, and they meet at the high or low of the day.
Finding the close at the open in a Bullish trend
For a Bullish trend, the close meets with the open or become near to the open. In a situation where the meetup (almost) of the open and close are near to the high, there is the possibility of uptrend continuation, and In case the open and close become near the low, then there will be a possibility of bullish reversal.
.png)
The above XRP/USDT chart entails a bar combination, of which I found a close at the open in an uptrend, which led to a bullish reversal, because the close at the open took place at the low.
Finding the close at the open in a Bearish trend
For a Bearish trend, the close meets with the open or become near to the open. In a situation where the meetup of the open and close are near to the low, there is the possibility of bearish continuation, whereas if the open and close become near the high, there will be the possibility of bearish reversal.
.png)
The above XRP/USDT chart comprises bar combinations, of which I found a close at the open within a downtrend.
Conclusion
Price Bars are very essential when it comes to crypto trading, since they help traders in terms of trend identifications and predictions. Traders who have fair knowledge about Price Bars usually come out of the market with flying colors, hence the essence for this publication.
The utilization of price bars in trading should be embraced just like the Japanese candlesticks, simply because they present better information of the various crypto markets in terms of trends.
Thank you and stay blessed.
.
muy interesante.es un juego que se vuelve mejor crecimiento