Btc Price Analysis By Chart Pattern and MA
Hello friends, how are you all today I hope you all are great and I'm good as well. Today we will talk about the btc market update, which includes it's further movement, fluctuations and the buying zone and what will be the target.

Made With Canva
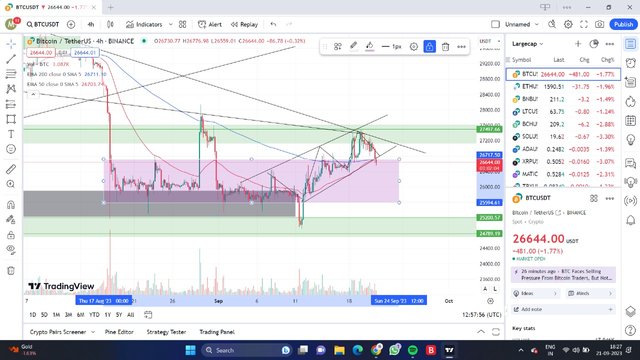
Well we can see btc price is now at 26700 zone with 1.3 percent down fall. Now you can see the btc with usdt pair ono thg 4hr chart , and according to this if we talk about its pattern then we can see a rising wedge pattern is formed and rising wedge pattern is a bearish pattern and we can see a fall in price due to this and if we talk about the buying zone then after the fall it will be at 25600 to 25200 zone.
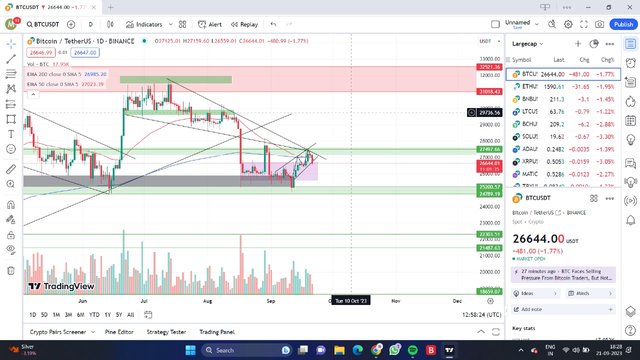
Then lets talk according to the 1 day chart, now we can see the resistance zone at 27100-27,500 and it will be very important and a heavy resistance zone from 27,100 to 27500, because first of all we can see a horizontal resistance and second you can see 2 trendline resistance as well so the dumping here is confirmed from this point and by dumping we will be back to our support zone , and if we talk about our support then the first will be at 25,200 and then will be at 24600.
I hope my price analysis will be useful for you all and I will try to make the representation more better as well, I made it few ours before but due to some work came between I have to hold the writing but the points I mentioned are all same and valid just you can see change in the price.
Disclaimer:- My views are not financial advice, this is my research you can buy or sell by following this and at your own risk if you like Didn't promote or influence any decision, and I'm not responsible for your profit or loss.
10% beneficiary has been set to @tron-fan-club.

https://twitter.com/SibanandaMaha14/status/1704866879809241324?t=eGnJnNZkZPnYUVxlwBZojQ&s=19
Btc Price Analysis By Chart Pattern and MA is a great content.