My technical analysis of the MATICUSDT Chart
MATIC is the native token for the Polygon Blockchain. The polygon blockchain is another popular blockchain that powers several projects. Of course, on this blockchain, MATIC is being used to perform a range of tasks.
Now let's get into the analysis.
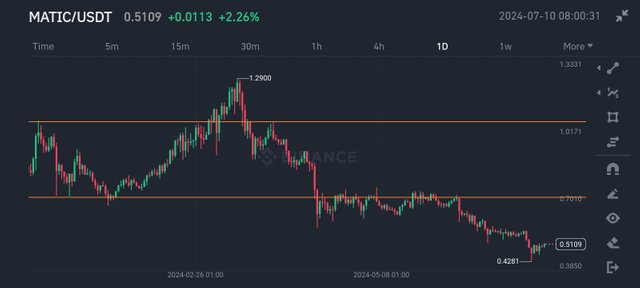
You can see from the 1 day chart that the price initially started falling after reaching the upper orange line (around $1) which I drew to emphasize that major resistance point. As the price fell, it fell until it hit a support zone around $0.73 (which I indicated with the lower orange horizontal line). Upon hitting that support line, it began its way up again.
This support line is a very significant point because we will see later on what happens at that point.
The uptrend continued until the price reached the $1.29 mark, and then embark on it's journey down. You can see that at some point during the downtrend, the price tried to go up a bit but it was strongly resisted. It's obvious that sellers did not want the price to go beyond that point. The downtrend continued until it got to the previous support zone, which I indicated with the lower orange line.
As soon as it got to that point, the price started going sideways. This is called consolidation. It means that there was indecision in the market at that point. Further proving that this is a significant region in the MATIC chart. This indecision continued for a while, as the price was neither going up nor coming down until finally, it continued the downtrend. So currently, the price of MATIC is on a downtrend. One important thing to note is that this downtrend is not steep. It looks like it is going sideways but it is also on a downtrend. The price of MATIC is 0.51 as at the time of this analysis (10th July), and I expect a further fall, considering the general condition of the crypto market right now.
The importance of the two points indicated with the horizontal lines is that they can help traders make decisions. For instance, when price hits the upper line, there's a high chance that it will be strongly resisted, and a downtrend could begin. So a trader would want to place a sell order at that point. Then if it hits the lower line, the trader can observe closely and either place or buy order or close the sell order.
To understand better what is going on in the MATICUSDT chart of recent, let's take a look at the 4 hour chart.
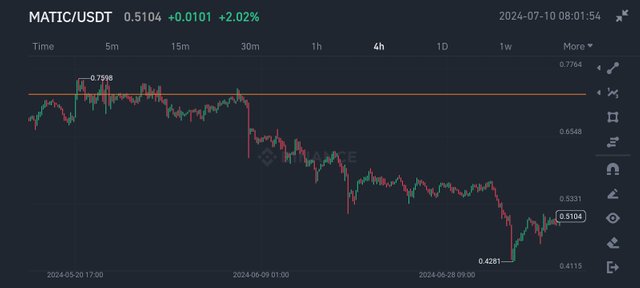
You can see how there was a period of consolidation here, just like there was in the 1 day chart. After that consolidation, the fall in price has continued. I am observing what will happen next, but like I mentioned before, I expect further fall in price.
That's it for my analysis of the MATICUSDT chart. I do hope you enjoyed it.
Note: This article is not a financial advise.
X (Twitter) link
Great analysis on maticusdt pair, ofcourse right now I believe almost all cryptocurrency asset are poised to go up, thanks for sharing though, good T.A skills mate.