My technical analysis of the LINKUSDT charts
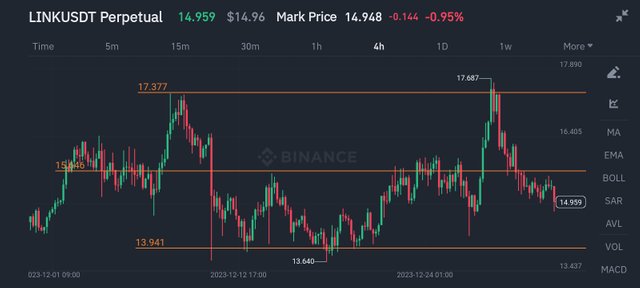
The LINKUSDT 4-hour chart shows a ranging market. It looks like it is going in a horizontal direction while fluctuating between support and resistance levels.
As you can see from the chart, the price initially went up to within $15.6, then it began consolidating. This meant there was indecision in the market. The price wasn't really going up or down at that point. It just went sideways. This suggests that there was equilibrium between buyers and sellers.
Eventually, the price pushed further up to within $17.3 but faced resistance at that point. Sellers got in and pushed the price back down until it hit $13.9, where it bounced from. This price range is also a significant support level. When the price bounced from the support, it got up to $15.6, which was a consolidation level before, and then price got resisted and made its way back down. Hence, the $15.6 price is now a major resistance level.
As the price went down, it hit the $13.9 range before bouncing back up. As you can see, this is a major support level because price kept bouncing repeatedly on that line. You can see that the price went up again to within $15.6 and faced resistance before pushing up to the higher resistance level of $17.3. I indicated this level with the top most orange line.
After facing resistance at that level, the price has been on a downward path and I believe it will keep going down until it hits an already established support level.
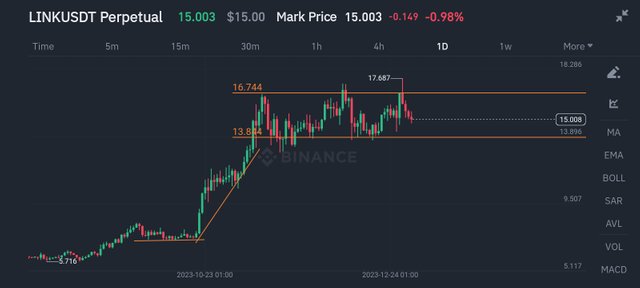
From the 1-day time frame, you can see a broader view of the LINK price movement. There was an uptrend that started and went on for a while before consolidation happened. During this consolidation, price went in the horizontal direction, which I highlighted with a horizontal line. After consolidating, the uptrend continued. I drew a trend line to indicate this uptrend.
By the end of the uptrend, the ranging market which we also saw in the 4-hour chart began. Price kept fluctuating between two major lines that served as support and resistance. Whenever the price hits the resistance line of $16.7, it is pushed back down until it hits the support line of $13.8 before bouncing back up.
Currently, the price is approaching the support level and I believe that after hitting this level, it will bounce back up and eventually breakout from the resistance.
Note: This article is not a financial advise
Nice analysis brother. Thanks for sharing this article.
Link coin is good project.
https://twitter.com/Oguzvic1/status/1742142839511777325?s=19
Link is a very good project in the crypto market and in the past this coin has also performed very well so hopefully the next market cycle can also be great for this project however the analysis you have shared is also good enough to have better understanding of the price of this coin
I can see your hard work here but I would like to know steem coin technical analysis So if you share it in the future, then it will be good Thanks.
Your article is very good. I hope you write articles like this in the future. thank you so much.