My technical analysis of the JUPUSDT chart
JUP is the native cryptocurrency of the Jupiter exchange. Jupiter is a decentralized exchange built on the Solana blockchain. It is also a liquidity aggregator. JUP is used to perform a variety of activities on the exchange.
Now, let us get into the analysis.
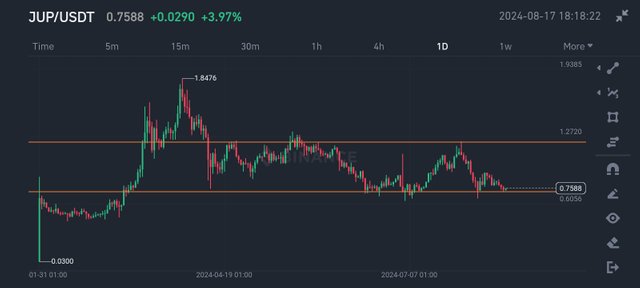
From the chart, you can see two horizontal lines which I drew to indicate two significant points. There was an initial pump in price, and then it started consolidating just below the lower line. It faced resistance but at that point but didn't fall. Rather, it just kept going sideways until it eventually got out of equilibrium and broke the resistance, starting an uptrend.
The price got up to a point and then it fell down a little, only to find support at the upper line (around $1.2). On finding support, it bounced back up and got to an all time high at $1.84.
From there, the price fell. It kept falling until it got to the lower horizontal line I drew (around $0.75) where it found support. From here onwards, what you can see is that it has been going up and down between the upper and lower line, refusing to go past those points. Whenever the price got up to the upper line, it would face resistance and fall back down, finding support at the lower line and bounce back up only to face resistance at the upper line again; and the cycle continued.
As at the time of this analysis (17th August) the price is at the lower line ($0.75) and it is gathering support. I expect it to bounce back up like it has done previously.
The importance of those two points indicated by the horizontal lines is that it has immense value to traders. It's like a template to follow. Traders can buy when the price falls to the lower line because there is a high chance that it will find support and bounce back up. Similarly, traders can also sell when the price gets to the upper line because there is a greater possibility it will face resistance and fall back down.
Let us take a look at the 4 hour chart to understand better the recent price movement
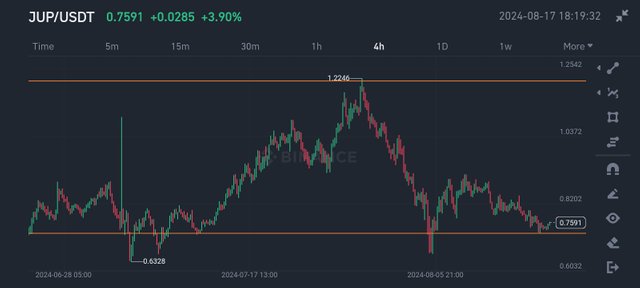
You can see from this 4 hour chart that the price kept moving between the two lines. It was moving on top of the lower line, and then pushed up until it got to the upper line where it encountered resistance as expected. It was obvious sellers didn't want the price to go beyond this point.
It got back down eventually to find support. Of course, buyers did not want the price to go beyond that point. Currently the price is at that lower line and I don't see it breaking the support. Like I mentioned earlier, the price will go back up from here like it has been doing.
That's it for my analysis of the JUPUSDT chart. I do hope you enjoyed it.
Note: This article is not a financial advice.
X (Twitter) link
Jup is good coin. Hopefully its price will be increasing soon. Thanks for analysis.