My technical analysis of the ETHUSDT Chart
Hello everyone. This time I'm going to analyze the ETH chart. First of all, Ether (ETH) is the native crypto of the Ethereum Blockchain. Ethereum is one of the most popular blockchains. A lot of projects are built on the Ethereum Blockchain. In my opinion, Ether (ETH) is the biggest altcoin.
Now, let's get to the analysis
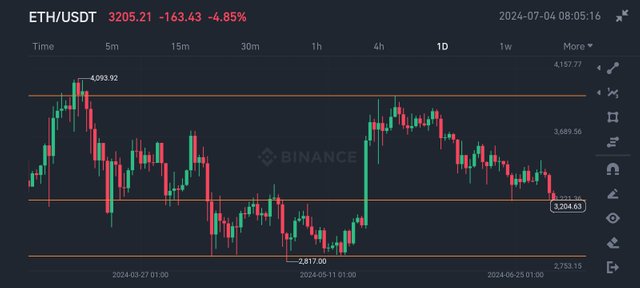
The ETH chart is a very interesting one. There are up and downs and several significant points which I indicated with the orange horizontal lines. From the 1 day chart, you can see that the price of ETH can't seem to get past that point I indicated with the upper orange line. That is around the price of $4000. It is a strong resistance zone. From the chart, when price got to that point initially (up to $4093), it got resisted heavily and was on a downtrend for long. It was obvious that sellers swooped in and pushed the price down.
You can see that after a period of downtrend, the price tried to make it's way up again, but it was resisted as it approached that same point. It couldn't get beyond that $4000 range. The price has been on a downtrend over since.
Another thing to point out is a crucial support zone. I indicated this point with the lowest horizontal line. When price was falling after reaching the resistance zone, it fell until it hit this support zone, and then it bounced back up. This support zone, which is around the $2800 mark), seems to be a very strong one and it is significant because it can give traders an idea of when a downtrend is about to change to an uptrend.
If you look closely at the chart, you will see a line I drew in the middle. That line is meant to point out significant points in the price movement. This point served as support multiple times in the chart. On two occasions, when price got down to that point, it bounced back up. Eventually, the price went below that point, and when it tried to go back up, it was resisted by the same point that acted as support initially. Currently, price is on a downtrend, and it appears to be finding support around this same zone. Anything could happen from here. As at the time of this analysis (4th July), the price of ETH was at $3200. I think the price will keep going sideways for while, and then break the support to continue the downtrend.
To understand better what is currently going on with the price of ETH, let's look at the 4 hour chart.
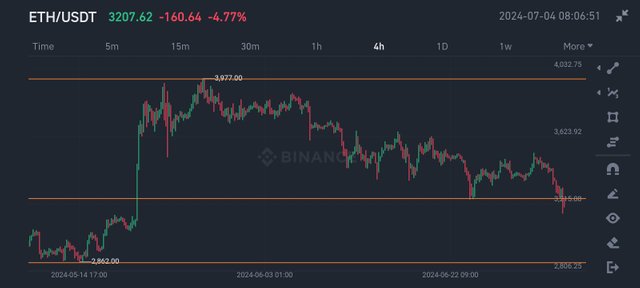
You can see that after the initial uptrend, the fall started. It wasn't a steep fall. I looked like it was going horizontally but it was on a downtrend. You can see that at one point, price bounced off the middle support line.
Like I mentioned earlier, I think the downtrend could continue, considering the general condition of the market. That's it for my analysis.
Note: This is not a financial advise
X (Twitter link)
Great analysis you have shared on ETHUSDT price chart, well hopefully we are set for a rebound in price to a bullish phase, one can only but hope. Great stuff.
Ethereum is the coin that is leading alt coin in the market and you have shared this useful technical analysis which I find interesting. Thanks for sharing this information with us.