My technical analysis of the DYDXUSDT chart
dydx is a decentralized exchange where people can carry out perpetual trading of a variety of popular cryptocurrencies. DYDX is the governance token of this platform which can be used to perform several activities on it.
Now let's get into the analysis
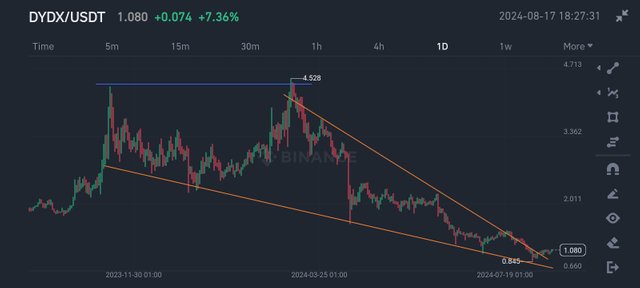
The DYDXUSDT chart is a really interesting one to analyze. Initially, there was a massive pump in price. The price went up until it reached its peak at $4.5. I indicted this point with a blue line. On touching the blue line, it faced heavy resistance and began to fall. It was obvious that sellers did not want it to go beyond that price so they came in and drove the price down.
The price got to a point where it started moving sideways. This horizontal movement went on for a while before the price went up again. It got to the blue line again and did not go beyond. Rather, it faced resistance and was forced back down. A massive downtrend began ever since.
Looking at the chart from another angle, you would see that from the moment the price seemed like it was going horizontally, it started some sort of downtrend. There were lower lows from that point. In order to confirm this, I drew the orange line connecting all the low points and you can see that the price was on a downtrend since then.
Furthermore, there were lower highs from the point where it face resistance and fell. I also connected those lower highs, and at the end, what you can see is some sort of a triangle forming. The triangle seems to be narrowing at the end. This is a popular chart pattern. As the triangle narrows, what is expected is a breakout. Price could breakout either in the upward or downward direction. In this case, the price already seems to be breaking out in the upward direction. I expect massive rise in price from here, especially since it has sold for so long.
For traders, the point indicated by the blue line where the price always got resisted after getting there is really crucial. They can place a sell order at that point because it is very likely that the price will be pushed back down from that point. Also, at the narrow end of the triangle, traders can place a buy order because there is every possibility of a pump in price from there.
Let us take a look at the 4 hour chart to have a better picture of the recent happenings in price movement.
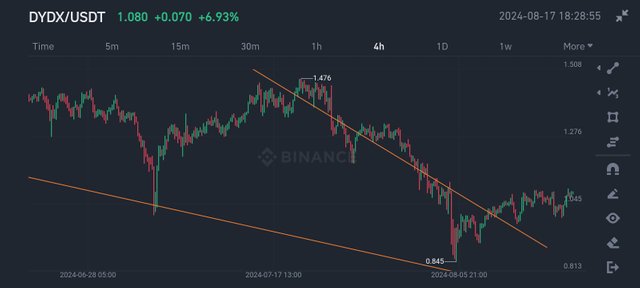
You can see that the price has been on a downtrend. The narrow end of the triangle is more magnified here, and you can see perfectly that the price has indeed broken out, and is probably about to start an uptrend. Like I said before, I expect a massive rise in price from here over a couple of days.
That's it for my analysis. I do hope you enjoyed it.
Note: This article is not a financial advice.
X (Twitter) Link
With the analysis of what you have done, it is really obvious that things are really working in the right direction and that is the reason we need to be very careful of investment
Please don't post similar pattern post always. Sometimes change the style of post and its quality. Thanks.
Noted