My technical analysis of the ADAUSDT Charts
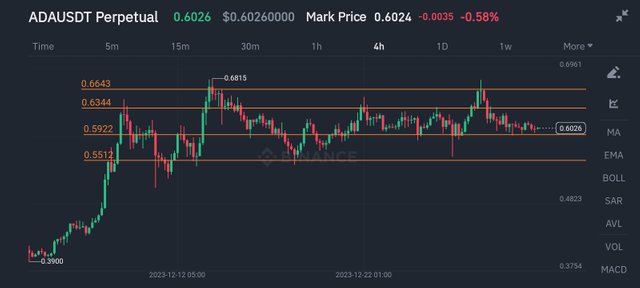
Hello everyone. Today I will be analyzing the Cardano (ADA) charts. In the 4-hour time frame, you can see that ADA was initially in a massive uptrend. It had a massive pump as you can see a lot of consecutive green candles. The uptrend continued until the price got to around $0.634, where it got resisted. That is a major resistance level indicating that sellers came in strongly at that point to drive price down. This same price level went on to become resistance level at several points on the chart.
As the price went down, it consolidated at $0.59 for a while before going further down. This level of $0.59 is also a significant level in the chart because it acted as both resistance and support level at multiple points later on in the charts.
When the price got to within $0.55, it jumped back up. This price is a crucial support level because, for a long period, every time the price got to that level, it jumped back up. Perhaps the traders didn't want the price to go below that level.
The price went up to $0.59 (which was a support level) only to get resisted. It went back down to $0.55 where it got support again. Next, it gained momentum and pumped up to hit another resistance level which was $0.66. From there, price went back down until it hit the $0.55 support level again. The price made its way up again and began fluctuating between two close levels of support and resistance ($0.59 and $0.63). Currently, the price is moving just on top of the $0.59 support level after facing resistance at $0.63.
From this chart, you can see that the price is not really moving in any direction. It is just going horizontally. Almost as if it is consolidating. I believe that it is gathering momentum for a pump.
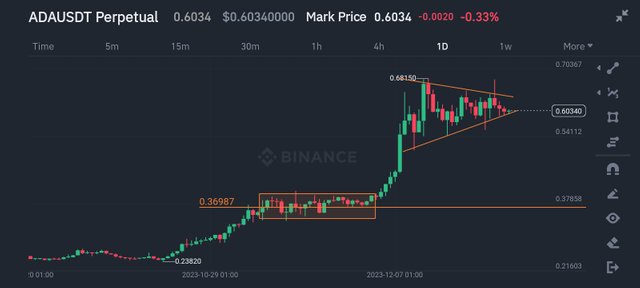
From the 1- Day chart, ADA started an uptrend. Then it slowed down and began consolidating at around $0.369. After consolidating, it gathered momentum and pumped really hard. At the top, it started some sort of consolidation again, forming a triangular pattern. Whenever a triangular pattern forms, there will always be a breakout. The breakout could be in the upward direction or in the downward direction. I believe it will break out in the upward direction. Only time will tell.
Note: This article is not a financial advise
Very good article. I think thia coin will give us profits in the bull cycle.
Your analysis on ada Usdt is just great, I really hope for one that it's considating to prepare for a massive move in the upside
https://twitter.com/Oguzvic1/status/1741497300231328189?s=19
Your analysis is nice thanks for sharing
Amazing analysis aboutada usdt . Your analysis is very effective I think. Thank you for sharing....
Along with post quality Please increase your engagement in the community by reading and commenting on others to get better support in the community. Thanks.
I will work on that right away.
Thanks.