My technical analysis of the ADAUSDT chart
ADA is the native cryptocurrency of the Cardano blockchain. It is used to perform transactions and other activities on the blockchain.
Let's get into the analysis
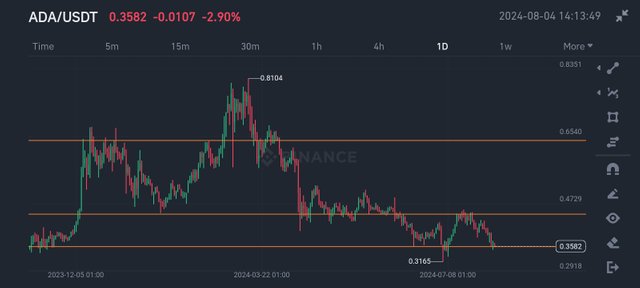
On the chart, I drew three lines to help with the analysis. Like always, these lines represent significant points in the price movement.
Initially, the price was seen somewhat consolidating at the lowest line (which is around $0.35). There was obviously indecision in the market since the price was just going sideways.
Then the price pumped up. It was a really sharp rise. As the price got to the upper line (around $0.64), it faced resistance. This resistance resulted in consolidation for a while. The price kept going horizontally until it finally gave in to the pressure of resistance and fell.
The price fell until it got to the middle line (which is around $0.44) where it found support. On finding support, the price bounced back up, starting an uptrend, and even broke the resistance signified by the upper line. After breaking resistance and going beyond the line, it came back down below it and couldn't seem to break the resistance again. Rather, it kept falling until it found some sort of support at the middle line.
The price consolidated at that point for a while. This shows that there was a balance between buyers and sellers as the price was neither going up or down, just horizontal movement along that line. Eventually, the price broke the support and fell lower, finding support again at the lowest line.
On finding support, it moved back up only to face resistance at the middle line where it found support before.
Recent, the price fell down, and as at the time of the analysis (4th August), it is on the lower line. I believe that it will find support there and bounce back up.
You can see how significant changes in price occured at these three line showing how important those point are. You can also notice how a line which served as support before later turned out to be resistance. This is something we see a lot while analysing charts.
In this case, the upper line served as a resistance zone; the middle line served as support initially, and later served as resistance; while the lower line served as support.
Traders can take advantage of these three points. They can sell when the price gets to the upper line because there a high possibility that the price would take a turn and fall. They can also buy when the price gets to the middle or lower line because there is a tendency for the price to go up.
Let us take a look at the 4 hour chart to have a better picture of the recent happenings in the chart.
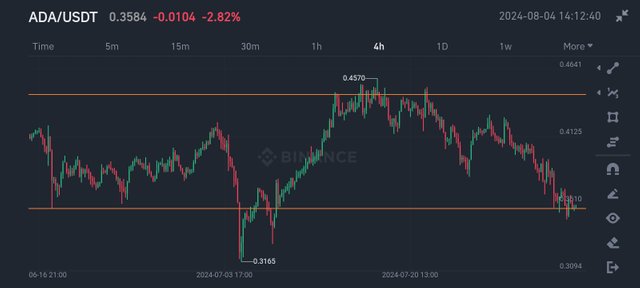
You can see that initially, the price was just consolidating on top of the lower line where it found support. Eventually, it went up and faced resistance at the upper line, which caused it to fall back down. Like I said before, I expect the price to find support again at the lower line and push back up.
That's it for my analysis. I do hope you enjoyed it.
Note: This article is not a financial advise.
X (Twitter) link
Great analysis of adausdt, hopefully the whole cryptocurrency market makes a speedy recovery 🤦
The project you have discussed is not new as ADA is one of the project that I have already seen a lot in the market since the time I entered in crypto. We also did pretty well in the market in the last cycle and hopefully they should be doing even better this time so stay hopeful.
A great post you have shared. We all hope cryptocurrency market will good in short time.