My technical analysis of MATICUSDT charts
MATIC is the cryptocurrency of the polygon Blockchain. It lets users transact and carry out different activities on the blockchain.
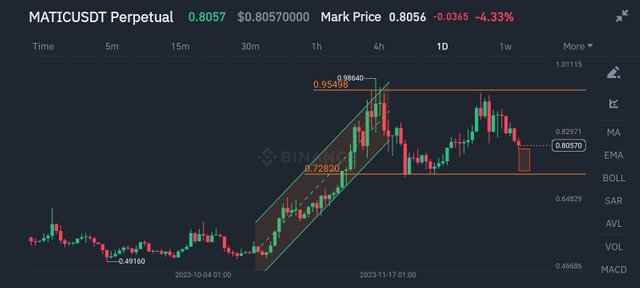
From the daily time frame, you can see that MATIC started an uptrend after consolidating at the bottom for days. The uptrend went on for days. I drew two parallel green lines to indicate this uptrend. The uptrend was probably in accordance with the bull run which we've seen recently in the crypto market.
The uptrend continued until the price got to the region of $0.954. As it got to that region, the price went back down. This suggests that sellers came in at that point and pushed the price back down. Furthermore, that price range seems to be a major resistance point. You can see the horizontal line I drew to emphasize this resistance level.
The price went down to around $0.728 and then bounced back up. This also suggests that it is a major support level. You can also see the horizontal line I drew to indicate this support level. Buyers probably came in at that point and pushed price back up. The price went back up until it hit the same resistance level of $0.954 which it got to before. Then it started its way back down. This shows that the region of $0.954 is a very strong resistance region and sellers are not willing for the price to break out of that level yet.
This up and down movement of the price between the support and resistance levels suggests that this is a ranging market. Currently, the price is approaching the support level. I expect it to get to that level and then bounce back up.
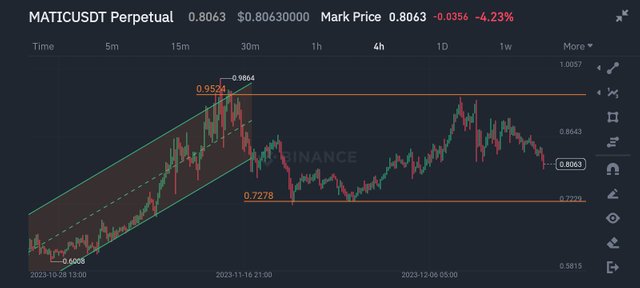
From the 4-hour chart, a similar scenario is playing out. There was an uptrend in the market until the price got to the resistance level. Then it became a ranging market. Price kept moving in between both horizontal lines, which indicates resistance and support levels. As the price moved towards the lower horizontal line (support level), it bounced back up. Also, as it approached the resistance level, it came back down.
My prediction is that price will bounce back up after hitting support level and eventually break the resistance.
You have share a very informationfull content
https://twitter.com/Oguzvic1/status/1737136469897085436?s=19
Matic is very strong coin. You shared about maticusdt chart.
In my opinion Matic is a valuable project in the crypto market and I expect that in the next bull run cycle it is going to do even better. Again this is not a financial advice but what I felt based on the market shared and thanks to you for sharing this technical analysis which is also helpful.
This is a great analysis you have shared here friend on the price chart of maticusdt. Keep sharing such quality content.
My favorite one is Matic, but I'm at a huge loss! $0.83 Buy Now $0.76🤕