My technical analysis of the TRXUSDT chart
TRX is the native cryptocurrency of the tron blockchain. It is used to perform a variety of tasks on the blockchain. One interesting thing about TRX is it's stability in price over time. It is not so volatile compared to other cryptocurrencies, making it one of the cryptocurrencies of interest.
Now, let us get into the analysis.
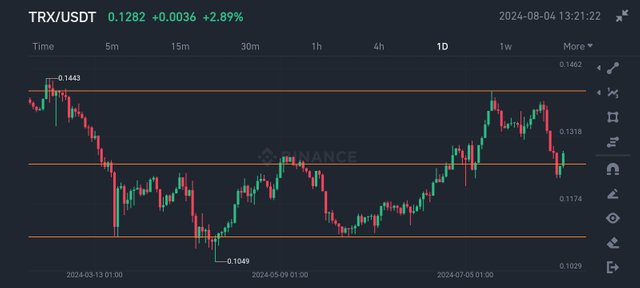
The TRX price movement has been quite interesting. In the usual fashion, you can see that I drew three lines, all of which indicate important points in the chart. The upper line indicates a strong resistance point (around $0.14). On multiple occasions, the price was pushed back down after reaching that point. This suggests that the sellers usually came in at that point to push the price down.
After price initially fell from the resistance, it got to the lower line, and then it bounced back up. This point (which is around 0.11), is significant because it is a major support zone. If you take a look at the chart, you would see that every time price fell to that point, it bounced back up.
As the price bounced back up, it got to the middle line I drew and faced resistance there, making its way back down. This middle line (which is around 0.12) served initially as resistance, but when the price finally broke that resistance and went higher, that point eventually served as support.
Recently, the price faced resistance again at the upper line, and it fell to the middle line which is now support, and as you can see, the price is gathering momentum and has started making its way back up.
You can see so far that the TRX chart is just about facing resistance and finding support around three major points. These are crucial points in the TRX price movement. Traders can take advantage of these points. So as soon as the price hits the upper line, one can predict that the price would go down and so, traders could place a sell order at that point.
The same goes for the lowest line. Once it hits that point, you can expect a bounce back up, so a buy order would be ideal. And as for the middle line, it would help traders be cautious because as the price approaches that point, one has to observe it will face resistance, find support, break resistance or break support.
Let us look at the 4 hour chart to have a better picture of recent movement in price.
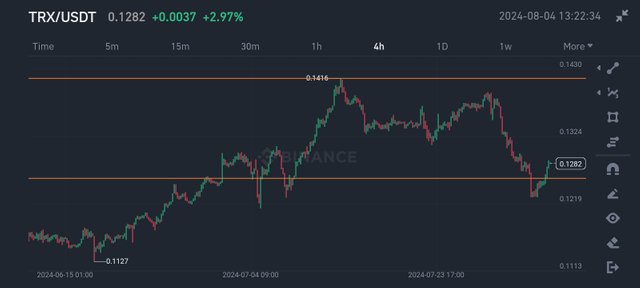
You can see that price was in an uptrend until it got to the middle line. It went sideways a little, probably because of a little resistance, then it eventually broke the resistance and continued the uptrend.
Eventually, it got to the upper line and faced stiff resistance there. The price was pushed down, consolidated for a while, and continued going down until it got to the middle line where it found support, and is about to make its way back up. I predict that the price would go up until it gets to the zone represented by the upper line.
That's it for my analysis. I do hope you enjoyed it
Note: This article is not a financial advice.
X (Twitter) link
Thanks for sharing these details technical analysis and I found it interesting to see how the point is doing in the market and what could be the next movement as well for tron coin
Nice analysis with chart. Nice trx price analysis. Thanks for sharing