The importance of the Dollar Index Chart in Analyzing the behavior of the Cryptocurrency Market
.png)
Background Image Source- Canva.com/Location

Assalam-o-Alaikum Steemians !
I'm @moneyster, a professional level Cryptocurrency investor and an analyser. As usual, today I thought to share another Crypto-related experience with you. I hope this article will be considerably beneficial for all the Steemians in this community
.gif)
 |
|---|
We already know that the value of all Cryptocurrencies depends on the entire money flow of the Crypto Market. As an example, when the BTC price is increasing, the dominance of the entire Crypto market is significantly increasing as a result of BTC dominance.
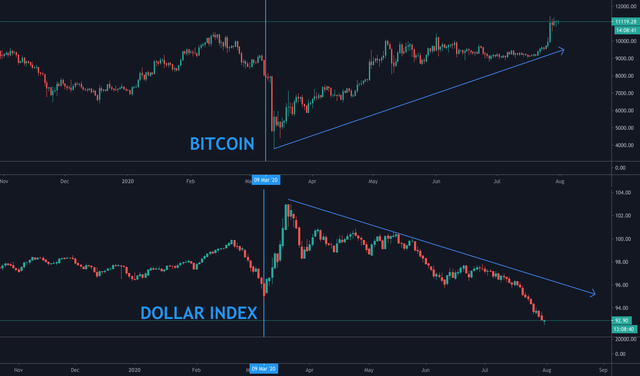
However, when the BTC price is falling significantly, we can see the Dollar Index Chart is increasing rapidly as a negative correlation to the BTC chart. This is because the Traders are moving their assets to USD based assets such as Fiat assets.
In addition to that, when the dominance of the entire Crypto Market is increasing significantly, we can see the Dollar Index Chart is falling rapidly as a result of the entire Crypto Market dominance. In this situation, people are moving their USD based assets to Crypto-assets as investments.
So, we have the ability to monitor this Dollar Index Chart for analysing our Crypto Charts in an effective manner. As an example, if we are able to see a considerable bearish sign in the Dollar Index Chart, we can take it as an opportunity to buy Crypto assets such as BTC.
Furthermore, a lot of larger Crypto Traders are looking for such patterns in the Dollar Index Chart for taking correct entries in the Crypto Market. As a result of their decisions, the trend of the entire Crypto Market can be adjusted significantly. So, we can also use such incidents as opportunities for taking our entries more effectively in addition to using Traditional Technical analysis methods.
Here we have the ability to predict the behaviour of the entire Crypto Market at a certain level by determining the behaviour of the Dollar Index Chart. If we are able to identify important patterns in the Dollar Index Chart using our technical knowledge, we can easily gain higher rewards in the Crypto Market in both bullish and bear markets.
As the larger Traders are focusing on the Dollar Index Chart, they have the ability to move the Market as per their desire. Therefore, there is a significant possibility to see a negative correlation movement between Dollar Index Chart and the BTC chart.
First of all, I will add this Dollar Index Chart to my BTC Chart at the same time using the TradingView platform. So, we can go to the "Compare or Symbol Search" panels and search "DXY" in the giver search bar. Below I have included a screenshot to demonstrate adding the Dollar Index Chart to our Trading Setup.
 |
|---|
Here I have taken an example of the best selling opportunity for BTC that I got from the Dollar Index Chart. When both charts negatively cross each other (Dollar Index Uptrend), we can get it as a selling opportunity for Bitcoin.
 |
|---|
Below I have taken an example of the best buying opportunity for BTC that I got from the Dollar Index Chart. When both charts negatively cross each other (Dollar Index Downtrend), we can get it as a buying opportunity for Bitcoin.
 |
|---|
--
In this way, we can use this Dollar Index Chart for getting better and easy trading opportunities. However, this is only one trading method and there are a few other trading methods that we can use with this Dollar Index Chart such as identifying bearish or bullish patterns of the Dollar Index Chart.
At the same time, as I said in my previous article, we should remember that all the Trading methods are not efficient completely as nothing we can find 100% efficient in the world. So, we should depend only on this Trading Method to confirm our trading opportunities.
I have studied the below-sourced articles to further study these topics and I have explained all the above facts in my own words and experience.
10% benificiary set for @tron-fan-club
Twitter Shared
https://twitter.com/moneyster12/status/1528436350051041280?s=20&t=o_H6Oa3Y6KAvYgcPmRJt2g
Thank you for contributing to #LearnWithSteem theme. This post has been upvoted by @cryptogecko using @steemcurator09 account. We encourage you to keep publishing quality and original content in the Steemit ecosystem to earn support for your content.
Regards,
Team #Sevengers
Thank you very much @cryptogecko for your support. I really appreciate it.
Nice information bro, a job well done
Thank you very much for your valuable comment brother. It means a lot to me.
Thank you for this information. I honestly didn't know about the dollar index chart until now.
Thank you for sharing with us.
You are most welcome. Yeah it is quite important for getting an idea about the market behaviour.
A very detailed analysis. This is very accurate and concise. I look forward to seeing more form you.
Thank you very much for your valuable comment. of course, hope to share a lot of such type of valuable articles here.
good post keep working to keep making interesting posts like this
Thank you very much for taking the time to read my article. Yeah I always try to do my best.
keep it up my friend
You've shared a great piece, traders will definitely find this useful as it will aid them in making better trading decision
It's really a pleasure to hear that this article was useful for you. Stay with me to see such type of content again.
Thank you for showing this graph to all of us, hopefully this is useful for many people.
Yue are most welcome brother. Yeah try to focus on this strategy too. Then you will be able to get a basic idea of the Market behaviour.