Basic Idea of The Peak Activity Levels to work with Significant Volume Profiles
.png)
Background Image Source- Canva.com/Location

Assalam-o-Alaikum Steemians !
I'm @moneyster, a professional level Cryptocurrency investor and an analyzer. As usual, today I thought to share another Crypto-related experience with you. I hope this article will be considerably beneficial for all the Steemians in this community
.gif)
 |
|---|
Peak Activity Level is a Volume Profile-based indicator that we can use for identifying the exact Trading Volume in the Market in real-time. This indicator is developed by LuxAlgo and he has developed this indicator as one of the best Volume Profile detecting indicators.
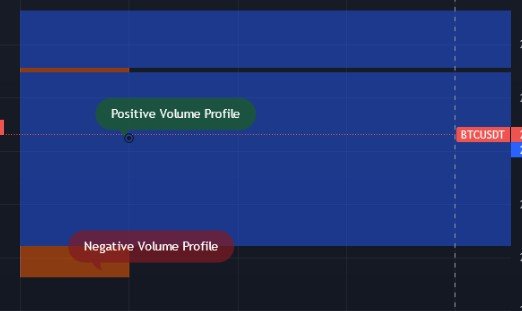
In this Peak Activity Level indicator, we can see there are two color Bars on the front side of the Candlestick chart window. As the default color, it shows Blue and Dark Brown color to indicate exact Volume Levels.
If we are able to see a quite Larger Bars with Blue color, it means that the Trading Volume is high as compared to previous levels. With the help of this indication, we can get a better idea of the Peak Activity Level. It means, we can see a good Uptrend in the chart with a considerably larger volume.
At the same time, If we are able to see a quite Larger Bar with dark brown color, it also means that the Trading Volume is high as compared to previous levels. With the help of this indication, we can get a better idea of another Peak Activity Level. However, this time, selling Trading Volume is the priority level in the chart. It means, we can see a good downtrend in the chart with a considerably larger volume.
This Peak Activity Level indicator is a very profitable indicator to determine the exact Volume Profiles in the Market. Here we can easily find Significant Positive Volume Profiles with the help of Blue Larger Bars. At the same time, here we can find Significant Negative Volume Profiles with the help of dark brown Larger Bars. As a result of these Blue and Brown Bars on the front side of the Trading window, we can easily predict the future market behavior at a certain level. However, the most interesting thing is that this indicator shows resistance and supports in the chart. We can use these support and resistance levels to Take profits or set stop-loss points to minimize our risk.
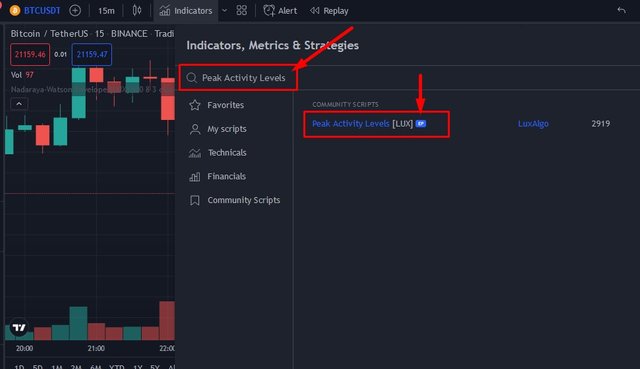
First of all, I will add this Peak Activity Level indicator to my Crypto Chart using the TradingView platform. Then we can go to "Indicators" through the tool panels and search "Peak Activity Level" in the giver search bar. Below I have included a screenshot to demonstrate adding the Peak Activity Level Indicator to our chart.
 |
|---|
Now I have demonstrated some good zones provided by this Peak Activity Level Indicator. Here we can see good zones to buy our assets or take a buy entry after confirming the entry from the larger Blue Bars generated by this indicator. Here we can clearly see the indicator has generated a clear larger blue bar in front of the price chart. I have shown a screenshot to demonstrate these Significant Volume Profiles.
 |
|---|
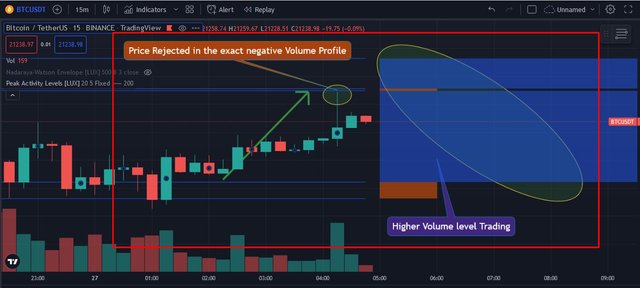
In the above screenshot, we can clearly see that the indicator has generated larger Blue Bars in front of the price chart. This is a good signal of a Higher Buy Trading Volume. At the same time, we can see there is a small dark brown bar on the Upper side of the Blue Bar. So, this zone can be a quite resistance zone to reject our price movement.
Below I have included another screenshot that I captured after a few minutes from the previous screenshot. So, you can clearly see that the price level has been rejected from the negative profile zone as expected.
 |
|---|
In this way, we can easily use these Peak Activity Levels to find exact Trading Volume and Volume Profiles in the chart and more accessible trading opportunities. However, we can try to combine this strategy with some other indicators to increase the winning percentage.
At the same time, as I said in my previous article, we should remember that all the indicators and strategies are not efficient completely as nothing we can find 100% efficient in the world. So, we should depend only on these strategies and indicators to confirm our trading opportunities.
I have studied the below-sourced articles to study these topics further, and I have explained all the above facts in my own words and experience.
10% benificiary set for @tron-fan-club
Twitter Shared
https://twitter.com/moneyster12/status/1541289975513317376?s=20&t=HnuBqzeBBq_dq4EXki3U0Q
I learn something new each time I ready your post. Thanks for putting a lot of work into your write up. Keep it up @moneyster.
Thank you very much for your valuable response to my article. It means a lot to me.
Hello dearest friend
Thank you very much for giving such an informative post.
I enjoyed going through your post and I hope to read more of your interesting post.
#steem-on 💙
Thank you very much for your detailed response to my article. It means a lot to me. .
#steem-on 💙
A wonderful post you've made here, I enjoyed reading it
Thank you very much for the quick feedback on my article. I really appreciate your cooperation.