Introduction to Technical analysis (Part 1) || 10% payout to tron-fan-club.
Technical Analysis is one of the fundamental knowledge every trader or intending trader must have as he begins his trading journey. The market is known to have a lot of uncertainties like high level of volatility and if care is not taken one could blow up his investment. Knowledge of T.A will guide a trader against unfavourable occurrence and reduce his loss to the bearest minimum.

Technical analysis can be defined as the act of using data (real-world) date in predicting the outcome of market in the future. Most trader, if not all uses T.A in their trading activities because it takes into consideration past data, statistics and occurrences in terms of movements,trends etc in predicting a future outcome.
With Technical analysis you can also spot the strength and weakness of an asset and take note of them for the future because one essential knowledge a trader must have is that patterns repeat themselves. Taking note of these patterns will help you make wise trading or investment decision.
Another thing Technical analysis will help you understand is price reaction in the market and trends. A trend could be long term or short term depending on the asset and the reaction of investors toward it. Technical analysis helps you understand that when one trend is controlling the market now, it will soon switch to the other with time. So no trend last forever.Let us check out some technical analysis people adopt for their trading activities.
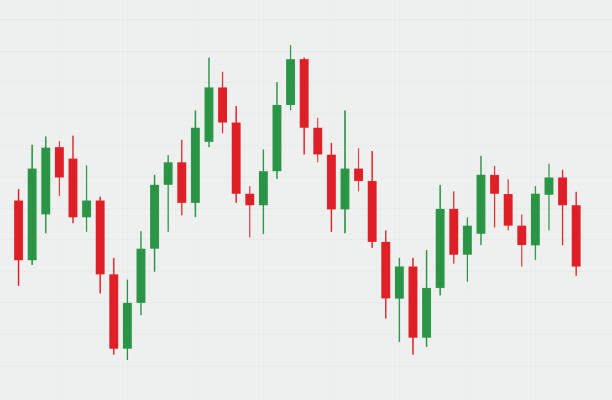
Candlestick chart is a chart that has been widely accepted by traders and this has been one of the major tools for technical analysis as it gives very useful information to trader via it formation. Well if you're new to this system,looking at a candlestick chart may look very confusing but it isn't really.
The candles are lined together and each candle supplies a vital information such as it nature (bullish/bearish - green/red) the opening price,the closing, the high,the low and the wick. When we'll understood,you will be able to make wise and timely investment decision as touching the market.

Trendlines is another form of technical analysis that good trader uses. I've established before that market can be highly volatile and one must be careful not to be victim of volatility. Trendlines will help identify the direction of the market; if the market is heading upward (bullish) or going downwards (bearish) or even sideway. When market go sideways it shows there is alot of indecision in the market and as such there is usually no clear direction.
A trendline just as the name sound is a line used in connecting lower or higher points (price) of a candlestick with the next in such a way that both are not on the same level and then you keep extending until the there is clarity on the direction of the market which could be upward or downward.

Support and resistance is another aspect of technical analysis you should understand. It should be your friend as it help you know the point where there is higher demand and higher supply and should I say it helps identify that point where buyers refuse to allow a further downward price movement by strengthening the buy position know as support point and where seller also refuse buyer a further upward movement by adding to their position such that demand drops,this is also known as resistance point.
Knowing this points can help you tread cautiously in the market so you don't get caught up in a snare
One could also see a breakout from both a support and resistance points. And this happens when either the bulls or the bear aggressive strengthen their position such that the former point of resistance or support gets weak and then breaks eventually. One should also be careful not to get caught up in what we call false breakout
I would have love to go further but I think it expedient I stop here so that it can be comprehensive enough for us to grasp. I will continue with the part 2 in my next post.
Thanks for digesting this presentation.
Regards
@lhorgic♥️
You've got a free upvote from witness fuli.
Peace & Love!
Thank you very much.
very good explanation hope this is very useful for many people here and also know how to see candles
Thank you so much dear friend. Am glad you found this useful.I also hope the people here will make the best out of it.
May you always be in the circle of good people
A big amen to you prayers.smiles😊
Thank you for contributing to #LearnWithSteem theme. This post has been upvoted by @cryptogecko using @steemcurator09 account. We encourage you to keep publishing quality and original content in the Steemit ecosystem to earn support for your content.
#Club5050
Regards,
Team #Sevengers
Thank you for the support it means alot.
Technical analysis is the Ultima goal to becoming a profitable trader
Yes bro. You're right. The need for this knowledge can it be overstressed.