The Foundation Of Crypto Trading : Support And Resistance Levels
Hello friends,
With a heart filled with joy, I humbly appear before this great community to discuss on the foundation of crypto trading.
I call it the foundation because, all other chart pattern depends on Support and resistance to become effective.
Before I begin, I'll love to extend my warm regards to the moderators and admins of this great community, I must acknowledge the hardwork you put inorder to make this community grow.
Like I earlier said, I referred to support and resistance as the foundation because it is quite very difficult to be a successful crypto trader without gaining an understanding on the operation of support and resistance.
Please follow along we begin.
SUPPORT LEVEL
The support level can be explained to be a region on the price chart where there is a strong buying pressure on a commodity.
This region tends to reverse prices back upward which leads to the switch in market control from the bears to the bulls.
The support level can also be explained to be a region where there is a pause in the market, a situation where the bears(sellers) can no longer push the price downwards due to the strength of the bulls(buyers)
It is a region that is usually found below the price chart, and the price of the commodity finds it difficult to break below it.
The support levels usually helps to show that the buyers are gaining strength over the sellers in the market.
The concept of support levels work in a sense that when the price of a commodity hits the support line, it is more likely to be rejected.
This is so because, as the price of the commodity approaches the support level, the price of that commodity reduces simultaneously.
And traders take this as a good opportunity to buy such commodity in bulk.
When a lot of experience traders decide to make profit from the fall in price of that commodity by buying in bulk, they tend to prevent the price of the commodity from falling any lower.
The formation of a support level is usually valid when the price makes several touches on the support level, and most times find it difficult to break below that region.
The support level of a price chart is more valid with a higher time frame, we can say " the higher the time frame, the more genuine the support level"
TYPES OF SUPPORT LEVELS
There are three types of support levels in crypto trading and they are:
- Horizontal Support
- Diagonal Support
- Dynamic Support
HORIZONTAL SUPPORT
As the name implies, horizontal support are support level that are usually formed with the use of horizontal lines.
They can also be explained to be horizontal areas on a price chart that tend to prevent the price of a commodity from falling any further due to a strong buying pressure..
The horizontal support line helps to connect horizontal price points where the price of the market has failed to break below.
It helps to serve as a good buy signals to crypto traders and also help them to minimize loss while trading.
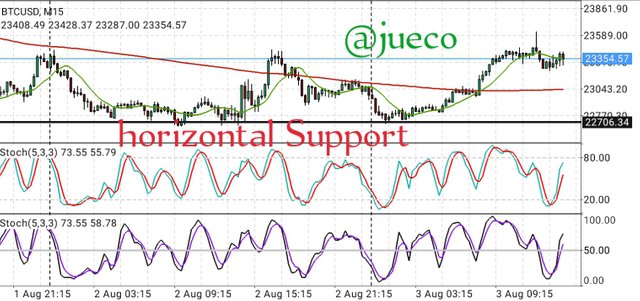
As shown above is a screenshot of the pair btcusdt on a 15min time frame showing the application of an horizontal support in a price chart
As shown above, the price made several touches on the support level but was unable to break below it.
DIAGONAL SUPPORT
The diagonal support follows the same principle as the horizontal support level, just that it is found in a trending market.
As the name implies, the diagonal support level can be explained to be a diagonal region on a price chart which the price of a commodity is finding difficult to break below.
It is a support region that consist of a diagonal line connecting the lows in a price chart.
The diagonal support level plays a major role in determining the overall trend of the market, it helps to predict trend continuation and trend reversal of a market.
With the use of a diagonal support, whenever the price breaks below the diagonal support and retest the broken region, it is therefore giving a sell signal.
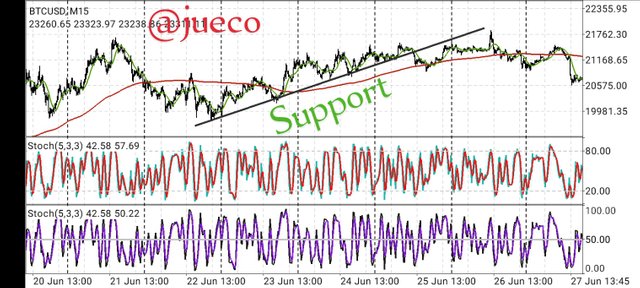
The screenshot above is the pair of btcusdt on a 15min time frame showing a diagonal support line.
As seen above, the price made several touches on the support line before breaking below it, here by indicating a switch in market control from bulls to bears.
DYNAMIC SUPPORT
The dynamic support is another very important support trading strategy, it differs from the others in the sense that its support region is drawn automatically with the use of an indicator.
With this form of support, the traders don't have to draw his support level as this has been done by an indicator.
A dynamic support is mostly found in a bullish market, where the price falls, hit the Indicator, and then get rejected.
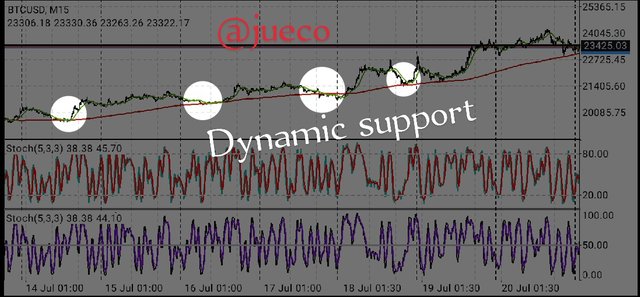
The Screenshot above is that of btcusdt showing a moving average acting as a support line.
As seen above, the price made several touches on the moving average and couldn't break below.
The touch it made on the moving average can be used as a good buy signal.
RESISTANCE LEVEL
The resistance level can be explained to be a region in the price chart that indicates a pause in the market activity, a situation whereby the strength of the buyers is no longer strong enough to push the prices upward because of the pressure from the sellers.
It is a region that is usually found above the price chart where the price of a commodity find difficult to break above.
In other words, the resistance level can be explained to be regions on a price chart where there is a strong selling pressure on a commodity, which tend to reverse back the prices of a commodity.
Thisbm region helps to signal the change in market control from the buyers to the sellers.
The concept of the resistance level is that whenever a price hits a strong resistance level, it is expected to be rejected.
And this is so because, as the price of the commodity approaches it's resistance line, it's price increases simultaneously and traders take this as a good opportunity to make gain by selling off their commodities.
When a lots of individuals sell of, it prevents the price of the commodity from increasing any further.
TYPES OF RESISTANCE LEVEL
There are three types of resistance level, they are:
- Horizontal Resistance
- Diagonal Resistance
- Dynamic Resistance
HORIZONTAL RESISTANCE
This is an horizontal level on a price chart that prevents the price of a commodity from increasing any further due to a high selling pressure.
The horizontal resistance can also be explained to be horizontal regions in a price chart where the price of the commodity find difficult to break above.
A horizontal resistance line also help to serve as a good sell signal, as it indicates the switch in market control from the buyers to the sellers.
The horizontal resistance consist of a line that connects horizontal points where the price of a commodity fails to break above.
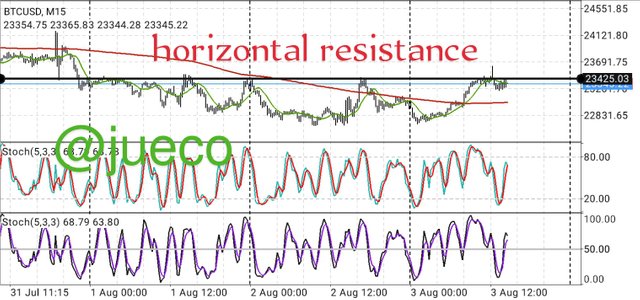
As seen above is a price chart that shows an horizontal resistance, and how it made several touches on the resistance line, but couldn't break above it.
Every touch made on the resistance line can be used as a good sell signal, as it helps to indicate a switch in market control from buyers to sellers.
DIAGONAL RESISTANCE
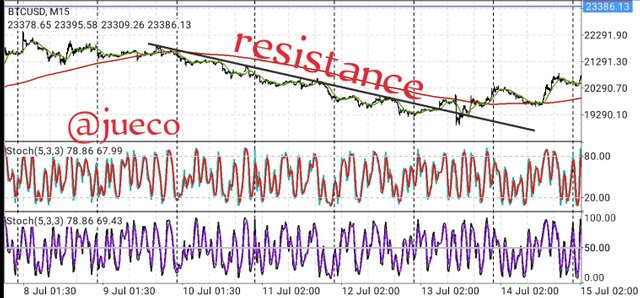
The diagonal resistance is one that is most often found in a trending market.
It is a diagonal region where the price of a commodity fails to break above due to a high selling pressure.
It also helps to Identify a trend continuation or a trend reversal In a chart.
This type of support is made up of a diagonal line connecting the higher highs of the price chart.
For better understanding, let's see the screenshot below.
As seen above, the price made several touches on the resistance line and finds it difficult to break above it.
When it eventually does, it indicated a switch in market control from the sellers to the buyers, which is a trend reversal.
DYNAMIC RESISTANCE
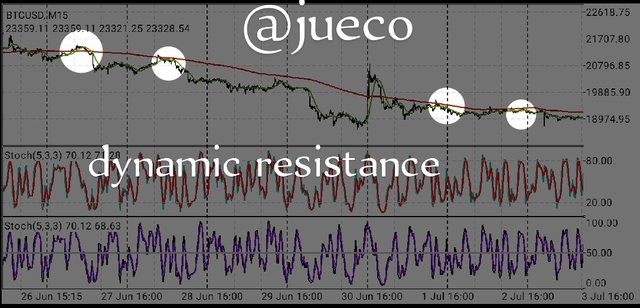
The dynamic resistance wouldn't be new to us since we have discussed on dynamic support.
Like dynamic support, the dynamic resistance makes use of Indicators as resistance line in the market.
When the price hits the Indicator, it tends to be rejected and move in the opposite direction.
With the use of a dynamic resistance, the trader doesn't have to manually search for a perfect resistance line as this has been done already by the Indicator.
The screenshot of the price chart above is one showing a good example of a dynamic resistance.
As seen above, the price had several touches on the moving average Indicator but couldn't break above it.
Recall that for a resistance line to be valid, the price must have made at least 3touches on it, and this is perfectly illustrated above.
IMPORTANCE OF RESISTANCE AND SUPPORT
- The proper study of support and resistance helps to predict trend direction of the market.
For example, if a market in a bullish trend fails to form new highs, but began to form low and eventually broke below the support, this will be an indication that the trend of the market is about to be changed.
- The knowledge of support and resistance helps traders to make effective trading decisions such as when to enter and leave a trade.
For example, with the knowledge of support and resistance, a trader will be able to identify false and successful breakouts.
The knowledge of resistance and support level helps a trader to set his stop loss and take profit appropriately, hereby minimizing loss and maximizing profits
The knowledge of resistance and support helps to tell the activities of the traders in the market.
For example, when the price is approaching a strong support, we know that the buyers are preparing to take over the market, as the strength of the sellers is becoming weak.
- Another Importance of resistance and support is that it can be studied alongside other technical analysis tools and it can be analysed on a multi time frame.
BREAKOUT ON A RESISTANCE AND SUPPORT LEVEL
When it comes to analysis using resistance and support line, breakout is a common thing that frequently occurs.
A breakout can be explained to be a phenomenon whereby the price forcefully cross above the resistance line or below the support line due to strong pressure from the buyers and sellers.
When trading support and resistance most traders rely on breakout for confirmation of signals and there are two types of breakouts, they are:
- Successful breakouts
- False breakouts.
SUCCESSFUL BREAKOUT
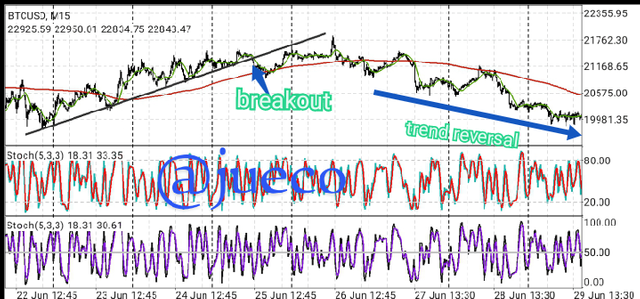
Successful breakouts is a phenomenon that is said to occur when the price breaks through the support and resistance level and continues in the same direction of the breakout
Successful breakouts are mostly used as trend reversal signals and sometimes trend continuation.
As seen above, there is a breakout on the support line on the price chart and this breakout signaled a trend reversal.
FALSE BREAKOUT
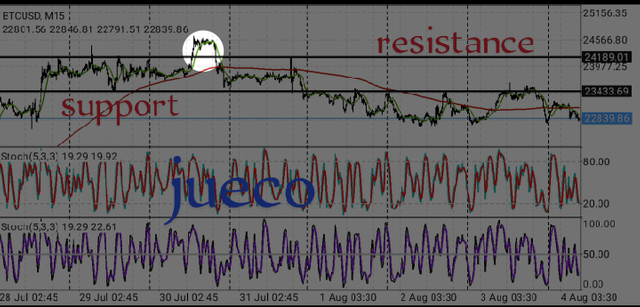
As the name implies, false breakout is an ingenuine breakout on the support/resistance level.
It is said to occur when the price breaks the support/resistance level but fails to continue in the direction of the breakout.
False breakouts occurs due to the spike in trading volume which cannot be maintained for long time.
As shown above, there is a false breakout on the resistance line of the price chart.
IDENTIFICATION OF SELL/BUY ENTRY FOR A SUPPORT AND RESISTANCE
Inorder to place a buy/sell order using the support and resistance levels, there are some key points one to lookout for, stay tuned.
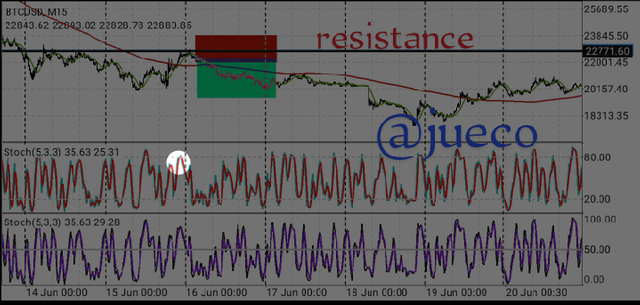
SELL ENTRY CRITERIA FOR A RESISTANCE LEVEL
The first thing to do is to identify your resistance level by making sure that it connects at least three of the price points on a chart.
Ensure that the price of the market is on the resistance line, and expect a price rejection.
Patiently wait for a price rejection by the formation of a bearish candle.
Look for confluence using other technical analysis tool such as an indicator, and you can also confirm your signal on multi time frame.
When this has been done, you can proceed to execute a sell order by placing your take profit before the next support of the chart price and stop loss a little bit above the resistance line
Place your order in a way that it gives you a risk-reward ratio of 1:3
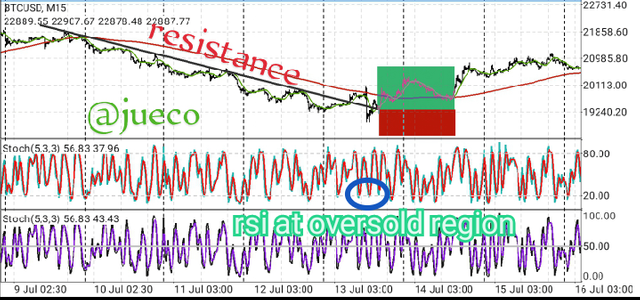
BUY ENTRY CRITERIA FOR A RESISTANCE LEVEL
Identify your resistance line and ensure that it connects at least 3 price points
Ensure that the price is on the resistance level and expect a price breakout on the resistance line.
Ensure there is a price breakout on the resistance line and patiently wait for a price retest on the broken resistance which will then be acting as a support.
Once this has occur, it serves as a confirmation for you to enter your buy order, but before then, ensure to find confluence using other technical analysis tools such as an indicator.
After the confluence, you can proceed to enter your buy trade by placing your stop loss below the broken resistance and your take profit in a way that gives you a risk reward ratio of 1:3
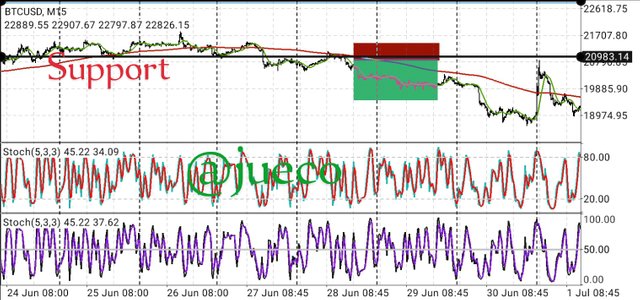
SELL ENTRY CRITERIA FOR A SUPPORT LEVEL
Identify your support line and ensure that the price has made at least three touches on the support level
Ensure that the price is on the support level and expect a price breakout on the support line.
Ensure there is a price breakout on the support line and patiently wait for a price retest on the broken support which will then be acting as a strong resistance.
Once this has occur, it serves as a confirmation for you to enter your sell order, but before then, ensure to find confluence using other technical analysis tools such as an indicator.
After the confluence, you can proceed to enter your sell trade by placing your stop loss above the broken support and your take profit in a way that gives you a risk reward ratio of 1:3
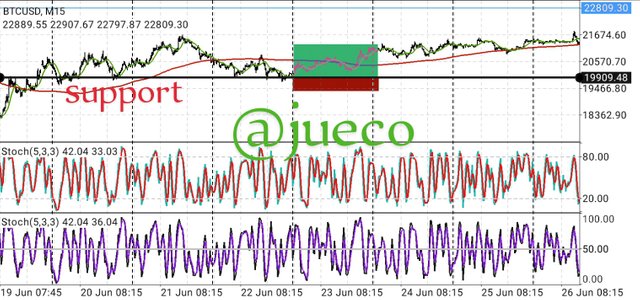
BUY ENTRY CRITERIA FOR A SUPPORT LEVEL
The first thing to do is to identify your support level by making sure that it connects at least three of the price points on a chart.
Ensure that the price of the market is on the support line, and expect a price rejection.
Patiently wait for a price rejection by the formation of a bullish candle.
Look for confluence using other technical analysis tool such as an indicator, and you can also confirm your signal on multi time frame.
When this has been done, you can proceed to execute a buy order by placing your take profit below the next resistance of the chart price and stop loss a little bit below the support line
Place your order in a way that it gives you a risk-reward ratio of 1:3
CONCLUSION
The resistance and support levels are important areas in the price chart where there is a pause in the market.
It also helps to spot Important trading opportunity, as traders can easily discern the activities between buyers and sellers in the market.
With the use of support and resistance, a trader can easily minimize loss and maximize profit in trading

You've perfectly described resistance and support levels as well as their uses. Excellent post.
Your article is really educative 🧡