LEARNING AND APPLYING CHART PATTERNS IN YOUR TRADING. (1)
REVERSAL CHART PATTERNS AND HOW TO SPOT THEMI
Hello Steemians and friends @tronfanclub ,
I greet you all my friends, and I welcome you to my new publications today ,as I walk us through a very important topic in trading which is <b CHART PATTERNS and how you can apply it in your trading to become profitable.But before that i will like to introduce myself to you all .
My name is @jonnchima, and I have been trading the financial market (cryptocurrency, forex stock) for more than a year now and applying chart patterns in my trading has been a great step I took in becoming a profitable trader .
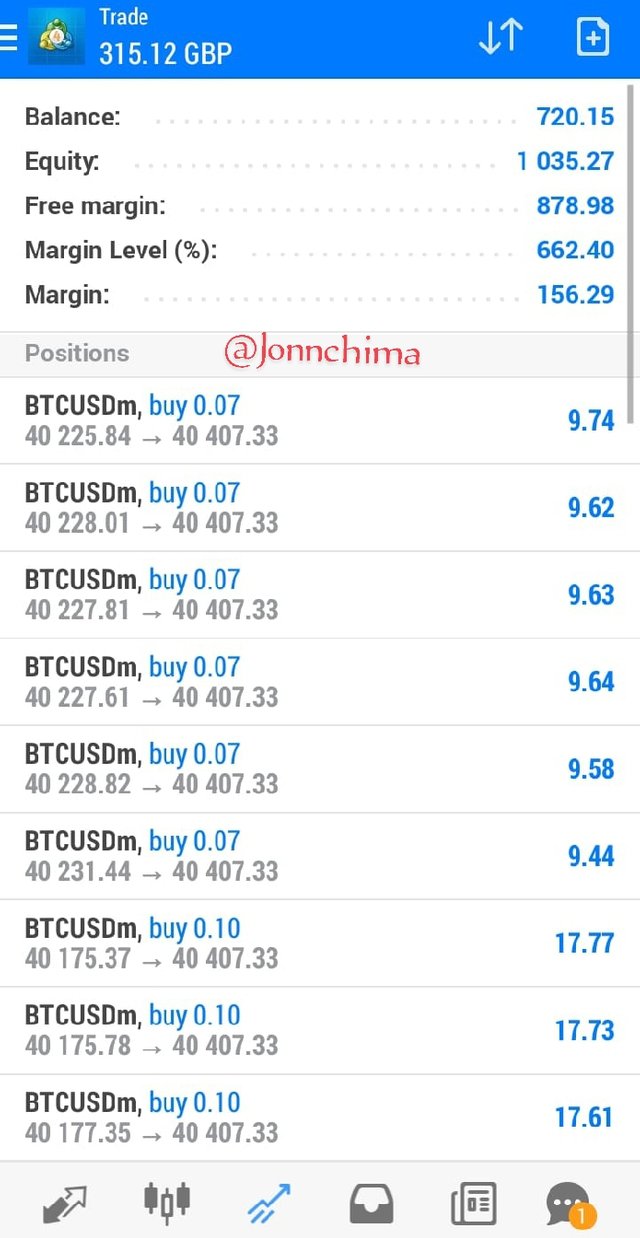
An account I have been trading since this year

Chart patterns are patterns formed as a result of certain price movement,this movement tells us a lot in the market, for example whether a reversal is about occur,or price is in a continuation phase.
CLASSIFICATION OF CHART PATTERNS
Chart patterns Can be classified based on the direction price move to after the patterns forms and we have two classification of chart patterns
BULLISH CHART PATTERNS 📈
These are patterns when formed signal a move of price to the upside.
BEARISH CHART PATTERNS 📉
These patterns when formed signal a move of price to the downside.
These classification of chart patterns leads us into what we know as the Types of Chart patterns.
TYPES CHART PATTERNS
We have three different type of chart patterns which is based on where price goes after the patterns forms,
REVERSAL CHART PATTERNS
CONTINUATION CHART PATTERNS
NEUTRAL CHART PATTERNS
But today I will be only discussing in a well detailed content Reversal Chart patterns for better understanding.

When we see reversal patterns, we look for price going in an opposite direction from where it came after the patterns forms.
For example if price was bullish , after a reversal pattern forms it becomes bearish and vice versa.
We have different types of reversal patterns but I will be only treating the major reversal chart patterns I make use of ,and how I use them to make the best of my trading decisions.
HOW TO SPOT REVERSAL CHART PATTERNS
Before I go into the types of reversal chart patterns we have, I want us to understand How and where we can spot reversal pattern because it is not everywhere on a chart you see reversal pattern you would want to take a trade .
Reversal patterns are most likely to react from key levels be it a major key level or a sub key level , but mostly at a major key level .
And key levels means the point in the market where price is mostly to turn at once it hit those levels. It is either the resistance and support zones or supply or demand zones.
TYPES OF REVERSAL CHART PATTERNS 📈
- DOUBLE TOP
Double top reversal chart patterns is also called the (M) FORMATION, this is because It looks like an M structure.
Here we price going up then it hit a key level which Is usually a resistance or supply zones and signal a move to the downside after the pattern forms.
DOUBLE BOTTOM
The double button it's also called a (W) FORMATION before we trade the double bottom we need to see price going down towards a key level be it a support or demand zones.
Then the pattern forms ,which signals that price or sellers in the market have lost the momentum to push price beyond the key level and buyers have come into the market to buy it, a move to the upside after after the patterns forms
HEAD AND SHOULDER PATTERN
This reversal pattern called the head and shoulder patterns because it resembles a head with two shoulders, one on the right one on the left.
Yeah price is seen on a bullish run creating series of higher highs and higher lows, after price breaks the recent high(left shoulder)
It's creates a new high at the key level here we see price going down then exhaust and further retraces back up but unable to break above the recent high created,(Head)
There by forming a lower high (right shoulder )
what happens was that buyers lost momentum when the market created a lower high , then the sellers came into the market to sell it further downwards. The head and shoulders patterns signal a move to the downside after the patterns forms..
INVERSE HEAD AND SHOULDER PATTERN
It's looks just like the head and shoulder but it is upside down It's happens at a lower key level like this support or demand zone.
price is seen creating lower highs and Lower lows , another price breaks the recent lower low (left shoulder) it then creates a new lower low(Head) at the key level then bounces up ,
Price is then seen to further retrace downward but it fails to break the last low created, thereby forming a higher low (right shoulder) before moving further up.
Yeah we saw the sellers in control but they lost momentum after failing to break through the last lower created thereby forming a highe low which is a perfect time for buyers to come into the market to buy.
- I look for a key level
- Then i for price to reach the key level
- Then I wait for the pattern to form above the keys level
- Then I spot or look for fade in momentum of the market on the zone
- Then I apply my other confluences like my 1 -5 structure
- I can't either choose to enter at the zone or wait for price to a break above the neckline and retraces back to the neckline then I enter with a good risk- reward ratio
Examples of chart patterns trade I took.
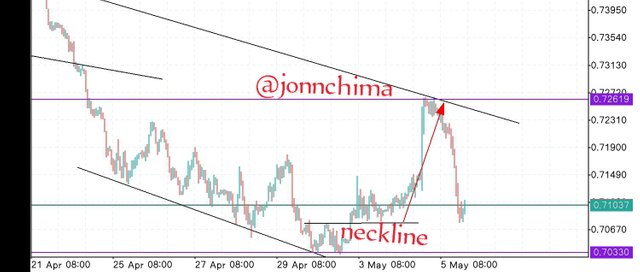
An example of double bottom
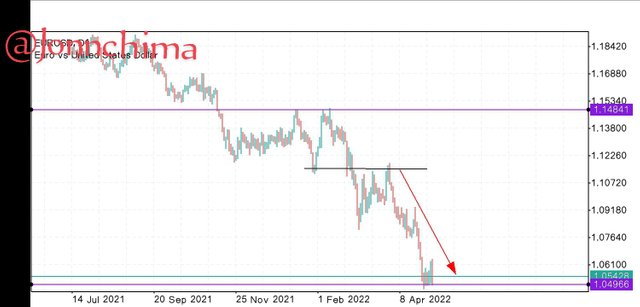
An example of a double top
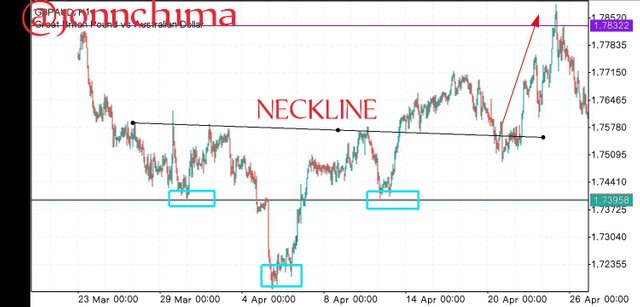
An example of an inverse Head and shoulder
CONCLUSION
Trading requires patience and once you are able to master the the act .you are just on your way to being profitable.
That is how I make use of chat patterns in my trading decision and win 90% of my trade I hope this piece was useful to you all
Thanks everyone who took out time to read my post..
Special thanks to @goodybest, @ngoenyi @whitestallion for the support they have
Given to me so far .

.png)
.png)
.jpeg)
about trading patterns we must really understand, we must know the movement of the chart.
There are steps in trading patterns which can make it profitable.
about trading patterns we must really understand, we must know the movement of the chart.
You have explained some of the pettern in a very nice way. Thanks
Thanks sir ..it all I have understood about the chart
Its very informative topic. Thanks for sharing. Increase your activity in the community to get more support.
Okay sir ..I just joined..any idea how to increase my activity here @engrsayful
Increasing number of posts and comment in the community
I will do just that sir
You have done really well in your explainations and you have provided perfect examples.
Keep up the good work
Thanks
C/up upvote has been done for this post on your active post with steemcurator03. Keep on enjoying Steemit Community 😊