TRADING WITH SHARKFIN PATTERN BY @horlah0//
INTRODUCTION
Hello wonderful people of Tron fan club am new to this community and this platform generally. I have checked all the necessary things I need to do to get started and I think am cool to go. I hope I'm welcome in this community
Let me get at it. What do I post in this community?
I will like to share my knowledge on trade patterns and strategies on this platform. I see that things posted here are crypto related. So I will share my basic knowledge on trading crypto. For my first post I will share with us how to trade with SHARKFIN PATTERN.
THE CONCEPT OF SHARKFIN PATTERN
When we are trading we must have seen this pattern but we don't know what it is called. The sharkfin pattern is basically used to trade reversal trend. It is a sharp reversal signal that tells us that a marker is about to change its trend. Most traders use it to trade new trend in the market.
When the sharkfin pattern is about to form,it form a higher high and reverses immediately after the higher high or it form a lower low and reverses immediately this is how the SHARKFIN PATTERN is formed for both bullish trend and bearish trend. The pattern form a V shape in the market chart that to indicate that a bullish trend is about to form while it from an inverted V shape to signal bearish trend in the market. No you see that we can detect the trend early with this pattern. But one more thing to make this pattern complete and valid for our trading is the addition of an indicator.
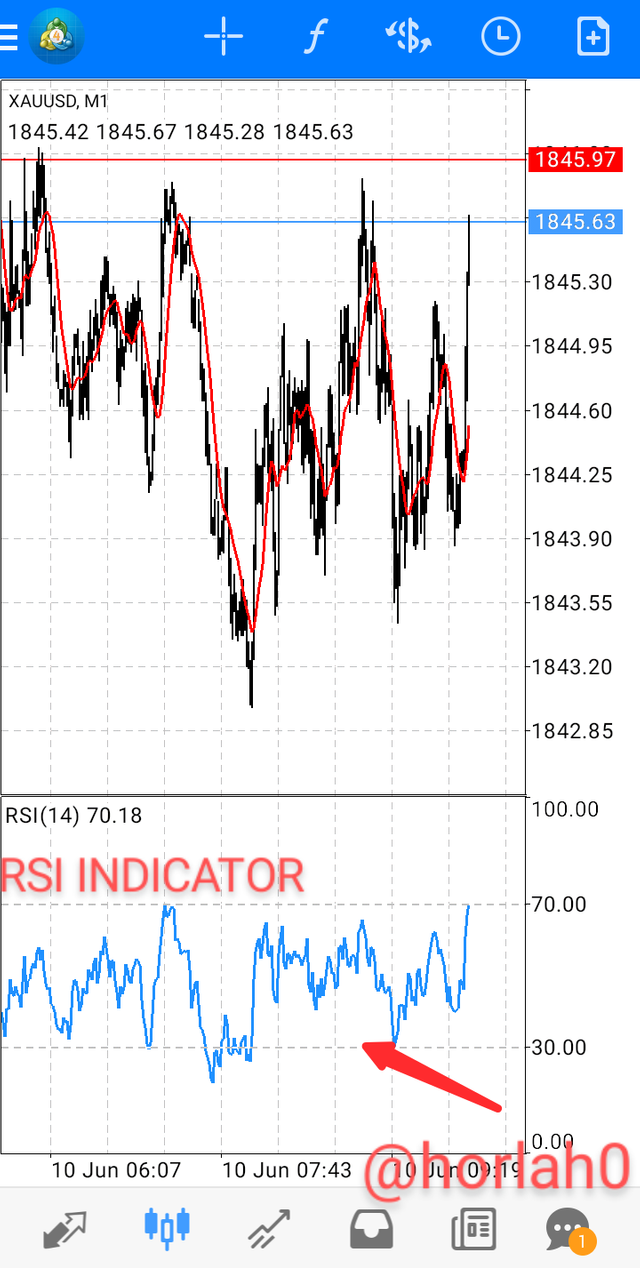
ADDITION OF RSI INDICATOR TO CHART
Looking at our market chart we can see many chart showing this pattern but now we will be looking at how to confirm if the pattern is valid or not.
That's why we will be adding the RSI INDICATOR to confirm this pattern. Am sure we know how to add RSI to our chart.
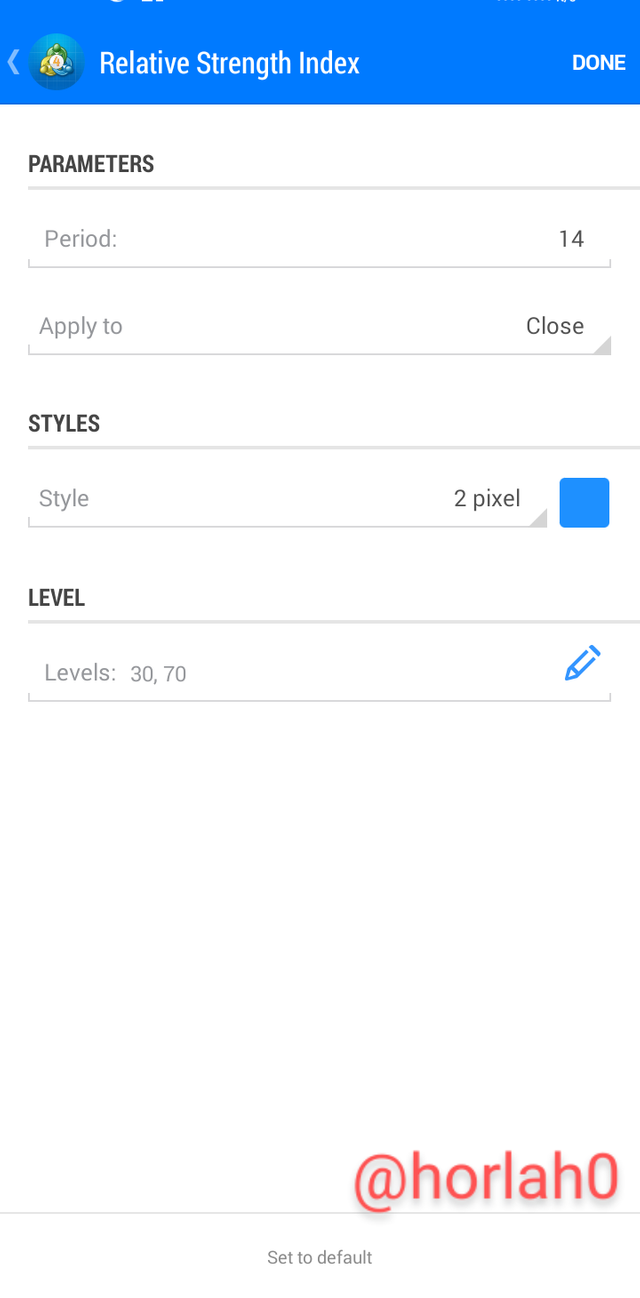
Simple way to add RSI indicator
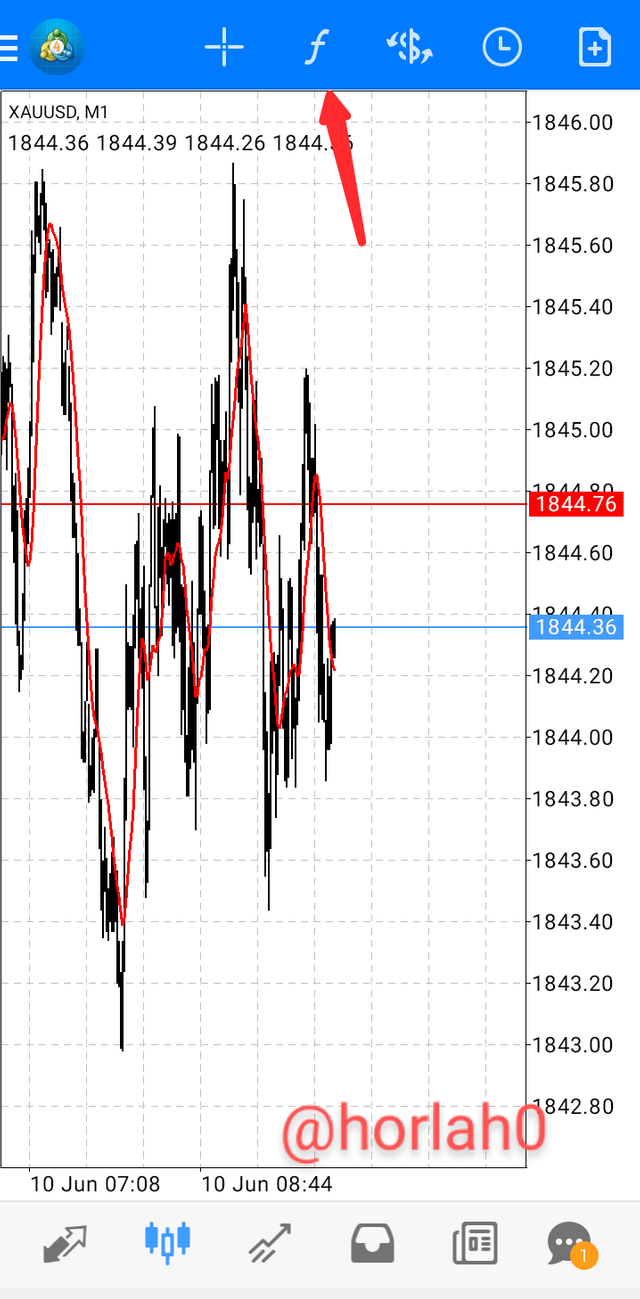
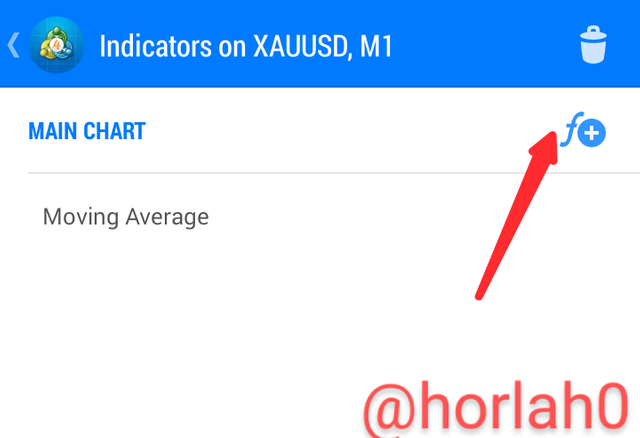
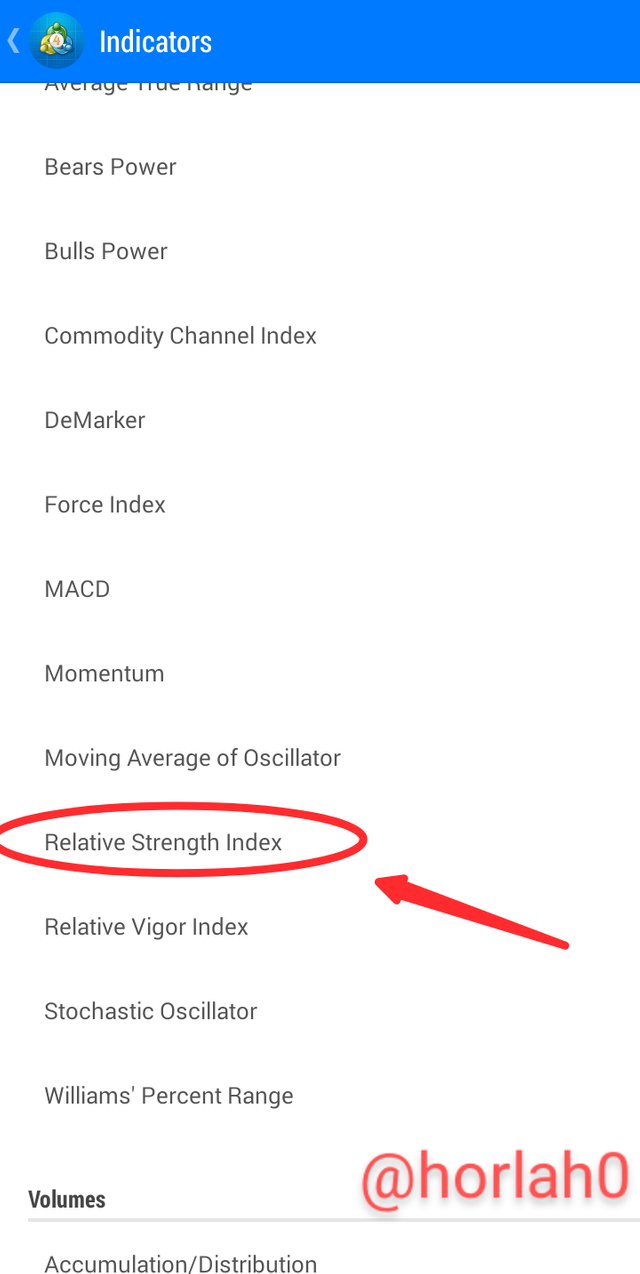
Open your metatrader4 app go to chart, on the top of the chart you will see a f sign click on it then you will click on the f+ sign meaning add to chart. After clicking on it you will see different set of indicator then you will search of RSI. After you must have found RSI in the Oscillator indicators you click on it and the press done you can leave the default settings.
Bellow are screenshots to show the process above.
Therefore, after adding the RSI INDICATOR to our chart this is how to use it to make confirmation of the SHARKFIN PATTERN.
FOR BULLISH/UPTREND
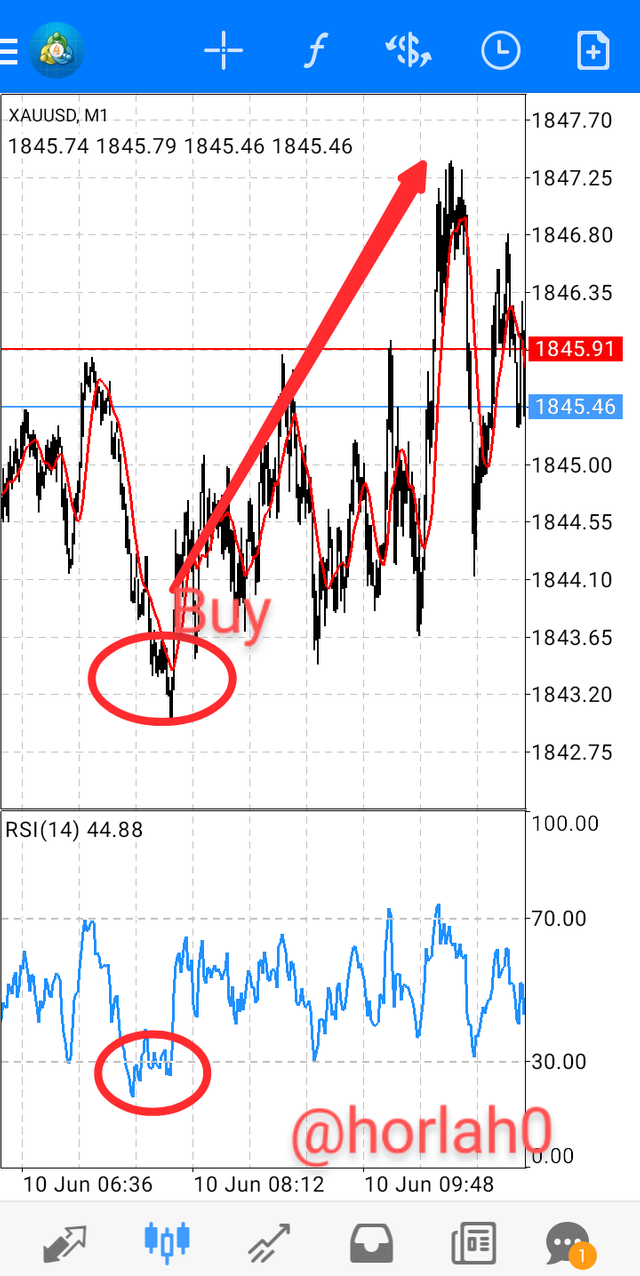
To use RSI as confirmation for a bullish trend, we look at our chart it must be in a downtrend session so we wait for the lower low and a quick reverse of a bullish candle then we check our RSI to see if the chart goes below 30 scale in the RSI indicating over sold. This is our confirmation we can buy now.
What am saying in essence is that if the RSI also show a V shape below 30 on the RSI and our chart also forms a V shape we can confirm that the trend is about to change so we wait for the next candle to form if it is an uptrend candle we can then place our buy order.
Below is a screenshot of a bullish SHARKFIN PATTERN.
FOR BEARISH/DOWNTREND
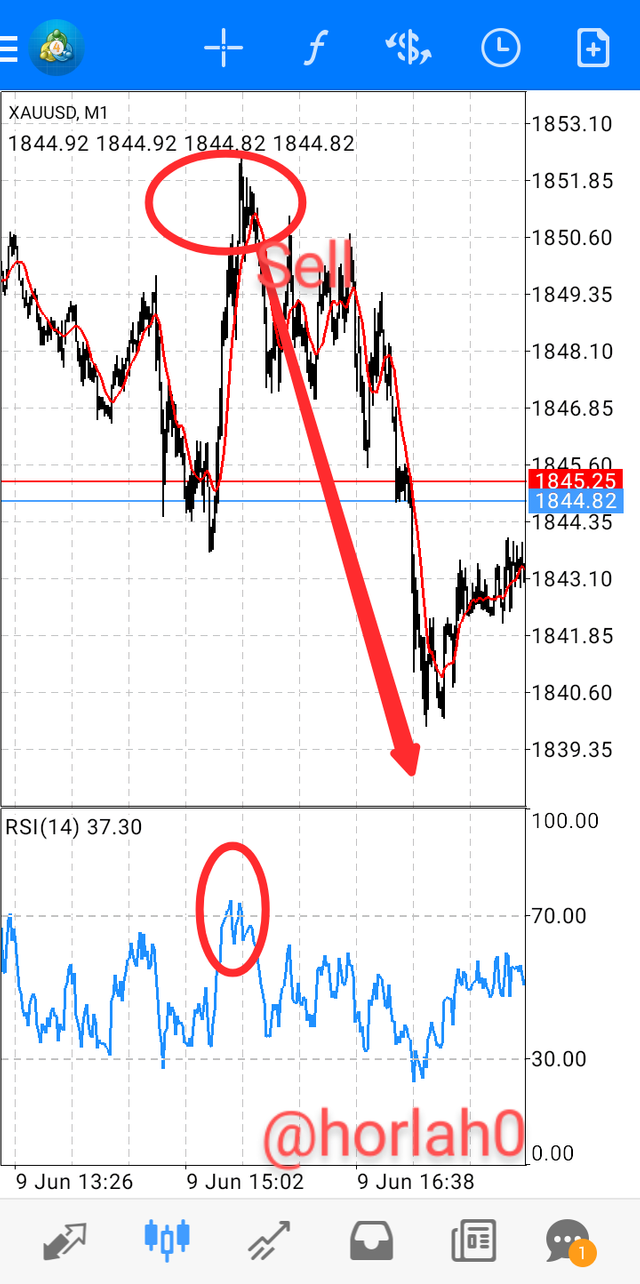
To use RSI as confirmation for a bearish trend,
we look at our chart it must be in an uptrend session so we wait for the higher high and a quick reverse of a bearish candle then we check our RSI to see if the chart goes above 70 scale in the RSI indicating overbought. This is our confirmation we can sell now.
If the RSI also show an inverted V shape above 70 on the RSI and our chart also forms an inverted V shape we can confirm that the trend is about to change so we wait for the next candle to form if it is a downtrend candle we can then place our sell order.
Bellow is a screenshot of a bearish SHARKFIN PATTERN.
CONCLUSION
I believe we all must have understand the concept of SHARKFIN PATTERN and how we can use it for our trading. The SHARKFIN PATTERN can be represented in different time frame. The higher the time frame the stronger the pattern and more profitable it will be.
Twitter link
https://twitter.com/Vhenom0/status/1535188624446210048?t=Uob_YeI_aAjao6e0kSe5ZQ&s=19
although it's a little dizzy to understand but I certainly have to learn to be like you Thank you for sharing
Thanks it's actually easy to understand you can give it a try with a demo account