TYPES OF LEADING AND LAGGING TECHNICAL INDICATOR - BY@BLISSUJU| 10% PAYOUT TO THE COMMUNITY ACCOUNT
It feels so good to be here again, I greet you all a wonderful afternoon from my country Nigeria. I want to believe that we all are in good condition today. as announced in my previous post where we got to know what technical indicators are all about, and also we saw the various types of technical indicators. I will be talking about the types of each of the indicators and also the functions of some of these indicators.
Allow me to recap a little. in the previous post we saw the two types of indicators and what they both can do where I mentioned that the leading indicator can forecast trends and activities both the previous, the present and the net trend movement that is like to take place. while the lagging indicator can only show us what the market has done already and also the present state of the market but it can not show us the next trend the market is likely to take in relation to the the cryptocurrency price.
Now let us head straight to the various types of leading indicators for more understanding.
TYPES OF LEADING INDICATORS
There are various types of leading indicators which helps traders to see what the market is about to do before executing a trade order. these indicators helps to forecast the most like movement of the crypto currency price in the market and that is why most investors and traders in the crypto currency market often make use of it and add it to their chart to get a better confirmation of the market activities and movement. the below are various types of the leading indicators.
THE RSI INDICATOR
THE SUPPORT AND RESISTANCE LEVELS
THE FIBONACCI RETRACEMENT INDICATORS
For now these are the three I am sure about. these indicators help traders to see what the market has done before, what it is currently doing and what is may likely to do. but then, we are not to be totally sure of these indicators as though we all know that they are made by humans and as such one can not agree and be fully confident in them because there my likely fail.
I have seen cases where a friend of mine uses the support and resistance levels to determine the net movement which the market is likely to take but to his greatest surprise, the market continued the trend it was on before he made the analysis. so that scenario made me to understand that this indicators are not fully sure, they are just there to guide us and bring out the most possible outcome but should not be taken with total believe of bringing out an accurate result during market analysis.
For more clarifications, I will be making an analysis with the support and resistance levels in other to make us understand the leading indicator more better.
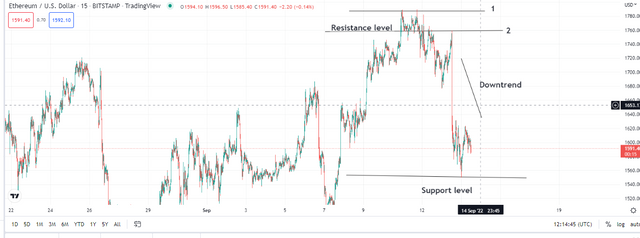
So as we all can see from the above chart of the ETHUSDT, the support and resistance level helps to predict the next trend that is likely to occur in the market. as you can see the price did not go below the previous support level and that is a positive sign that the market will take an uptrend level. so with this illustration, I believe we now know some types of the leading indicators and how they work.
Now let us take a good look at the lagging indicators that are found among other indicators which are use to make market analysis.
TYPES OF LAGGING INDICATORS
The lagging indicators are mostly used by crypto currency traders in other to see what they have missed in the market. they make use of it to know the just concluded activities in the market so as to know the type of entry to execute in the trading market. here are some of the lagging indicators that are used by crypto currency traders to analyze the market before making their entry.
THE BOLLINGER BANDS INDICATOR
THE EMA INDICATOR
THE PARABOLIC SAR INDICATOR
So like I said earlier, these indicators are only responsible to bring out the data, activities that has already been carried out in the crypto currency market trading, they can also show us what the market is currently doing but they can not tell or detect what the market is likely to do because their ability is limited to just the past and present action portray by the market but can not determine the next movement of the market.
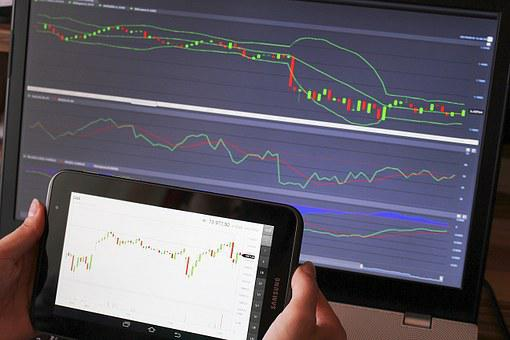
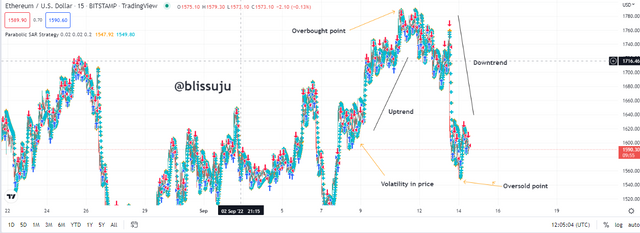
Now let me make a simple market analysis with the parabolic sar indicator to further prove my point on this topic.
The above is a market analysis of the ETHUSDT, and I made use of the parabolic sar indicator. as you can see the indicator can only display what has happened in the market but it can not show us the possibility of the next movement in the market so that is why it is called a lagging indicator.
It is always advisable to not just rely on an indicator, make use of many indicators for a clearer vision to see what is really happening in the market before you execute your trade because it is necessary so that you do not get false signal while trading in the crypto trading market.
I have come to the end of my article. goodbye for now
This is a great teaching ma. Indeed i have understand the leading and lagging indicators, thanks for sharing.
I am glad you followed my teaching so well. Greetings to you.
Thanks for sharing this great information on lagging and leading indicators.
You are welcome my friend and thanks for visiting.
The leading and lagging indicators are often used concurrently.
You are right my friend, Thank you so much for your visit.