Understanding Patterns | Crypto Trading Using Falling and Rising Patterns || 10% to tron-fan-club
Hello everyone in the Tron-fan-club community, I welcome you once again to my post today, have made it a habit to always teach crypto beginners how to trade, and how to recognize crypto patterns, the pattern I shall be discussing today is the rising and falling wedge pattern, we best know that with this pattern, we could easily identify what the market will do and predict ahead the next direction the market might move in.
First thing first, we can identify this pattern by placing falling trendlines or rising trendlines on the chart, then we draw the support and resistance lines so as to predict our next expectation from the market.
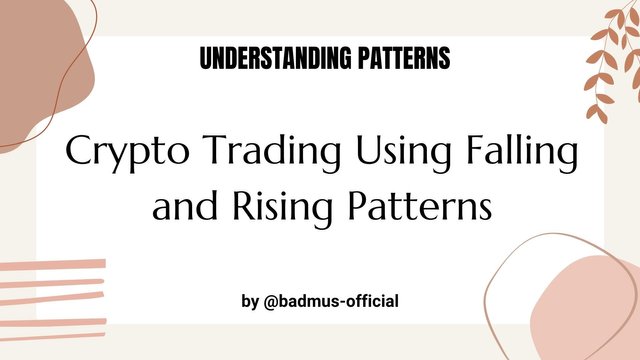
Falling Pattern - We get to witness a falling pattern in the market when we saw the market touching two or three resistance lines, in this case, the market is falling to the support level, when a market has been considered oversold and the pattern also has been falling, this may likely mean a reversal after the market has been sold, Example of a falling pattern below.
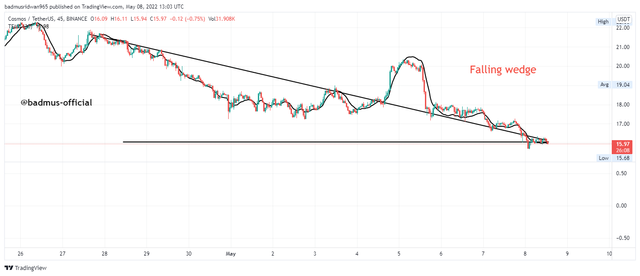
Trading Falling Pattern - The whole idea of crypto knowledge is knowing when to sell, and also when to buy, the patterns have separate meanings and we consider the market emotion, the best trade to place in a falling wedge is the BUY trade, as this implies the market has been oversold, and a reversal will occur anytime soon, especially in the bearish trend.
To confirm the entry, we can as well add volume indicators such as MACD or RSI, in this case, I was using the MACD indicator to confirm my entry.
From the image above, we could see a perfect entry for buy as we saw the MACD indicator to be rising towards the zero line, the market as well is about showing a trend recovery, and the market trade was placed in a 1:2 risk-reward ratio.
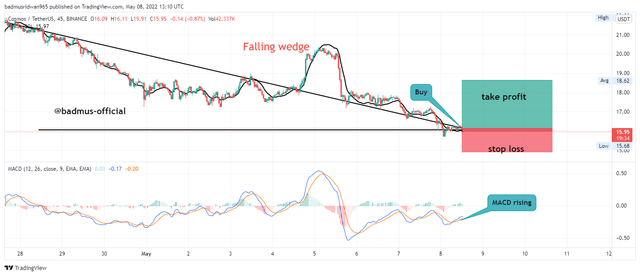
Rising Pattern - We get to witness a rising pattern in the market when we saw the market touching two or three support lines, in this case, the market is rising to the resistance level, when a market has been considered overbought and the pattern also has been rising, this may likely mean a reversal after the market has been bought,Example of a rising pattern below.
Trading Rising Pattern - The whole idea of crypto knowledge is knowing when to buy, and also when to sell, the two patterns have separate meanings and we consider the market emotion, the best trade to place in a rising wedge is the SELL trade, as this implies the market has been overbought, and a trend reversal will occur anytime soon, especially in the bullish trend.
To confirm the entry, we can as well add volume indicators such as MACD or RSI, in this case, I was using the MACD indicator to confirm my entry.
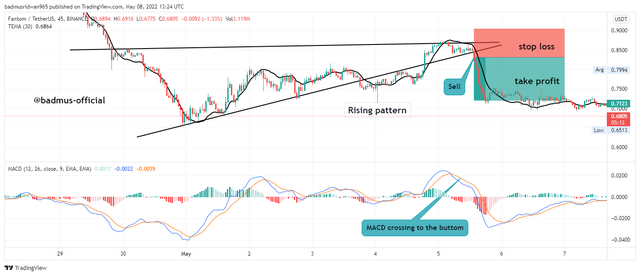
From the image above, we could see a perfect entry for sell as we saw the MACD indicator to be falling towards the zero line, the market as well is about showing a trend recovery, and the market was best placed in a 1:1.5 risk-reward ratio.
Understanding market pattern is crucial to learning more about cryptocurrency market movement, the crypto always has patterned its best to utilize these patterns to our advantage, there could be the addition of indicators such as the MACD indicator to confirm the market movement.
The MACD indicator gives a signal in a moving line, when the MACD crosses to the top, indicates a bullish trend, and when it crosses to the bottom, it indicates a sell signal.
I hope each and every one of us has learned a thing or two about crypto trading using the rising and falling pattern, THANK YOU!!!
Greetings man. Happy Sunday to you.
You can either use #fintech or #learnwithsteem tag. Using both tags is confusing. Regardless of the tag used, your post will still be seen. To my knowledge, you have delivered a lesson on chart patterns. I think this is just a tip of the overall lesson on Chart patterns. You can start this lesson by explaining charts in the financial market, then chart patterns and so on. A newbie trying to learn from this post will be more confused. This is "Learn with Steem" and not just a normal post. I'm looking forward to more lessons/tutorials from you. Have a great day.
Thanks for stopping by my post, I will not make further mistakes with the tags.
I have actually explained charts and trends in my previous post in the same community, this is more of a continuation, but I will try to explain further next time.
Have a great day too.
Thank you for contributing to Learn with Steem. This post has been curated by @reminiscence01 using @steemcurator09 account. We encourage you to keep publishing quality and original content in the Steemit ecosystem to earn support for your content.
Cc: Team SEVENGERS
Thank You.
Thank you very much for explaining to us how to trade coins here, hopefully this is useful for beginners who want to try it.
yes, I hope most beginners get to use the knowledge, thanks for stopping by.
You have a wonderful discussion with us today about the chart pattern. Your discussion provides a very important idea about the chart pattern. There was informative discussion.
Thanks for reading, I'm glad you were able to learn something from the article.
This post was shared on Twitter Link
You have done a good lesson regarding Falling and Rising Patterns. This is really important for every Crypto Trader in this community. I hope you will continue this lesson moreover.
Yes, the pattern always comes to shed light on the crypto market, I will try my best and teach further on some crypto topics.
Thanks.
Gave a very good idea about crypto trading. Because we don't understand when the price goes up. He has described everything in a very beautiful way. Good luck to you.
Thanks for visiting, I'm glad you found it helpful.